

This week, markets received a mix of positive signals. Alongside a US-Japan trade deal and talks with the EU and the Philippines, President Donald Trump made an unusual visit to the Federal Reserve to inspect its $2.5 billion renovation project and publicly spar with Fed Chair Jerome Powell over its cost.
While the visit drew headlines, investor sentiment remained focused on easing trade tensions and stronger-than-expected earnings. These developments have helped support further upside across major indices, including the , , and .
All of this is a positive sign as it could help boost demand in both the US and Europe, especially with the current earnings season showing mostly good results so far.
NASDAQ Surges to New Highs
In recent months, the main US tech index has seen a sharp rise, reaching new all-time highs. The current macroeconomic conditions support the upward trend.
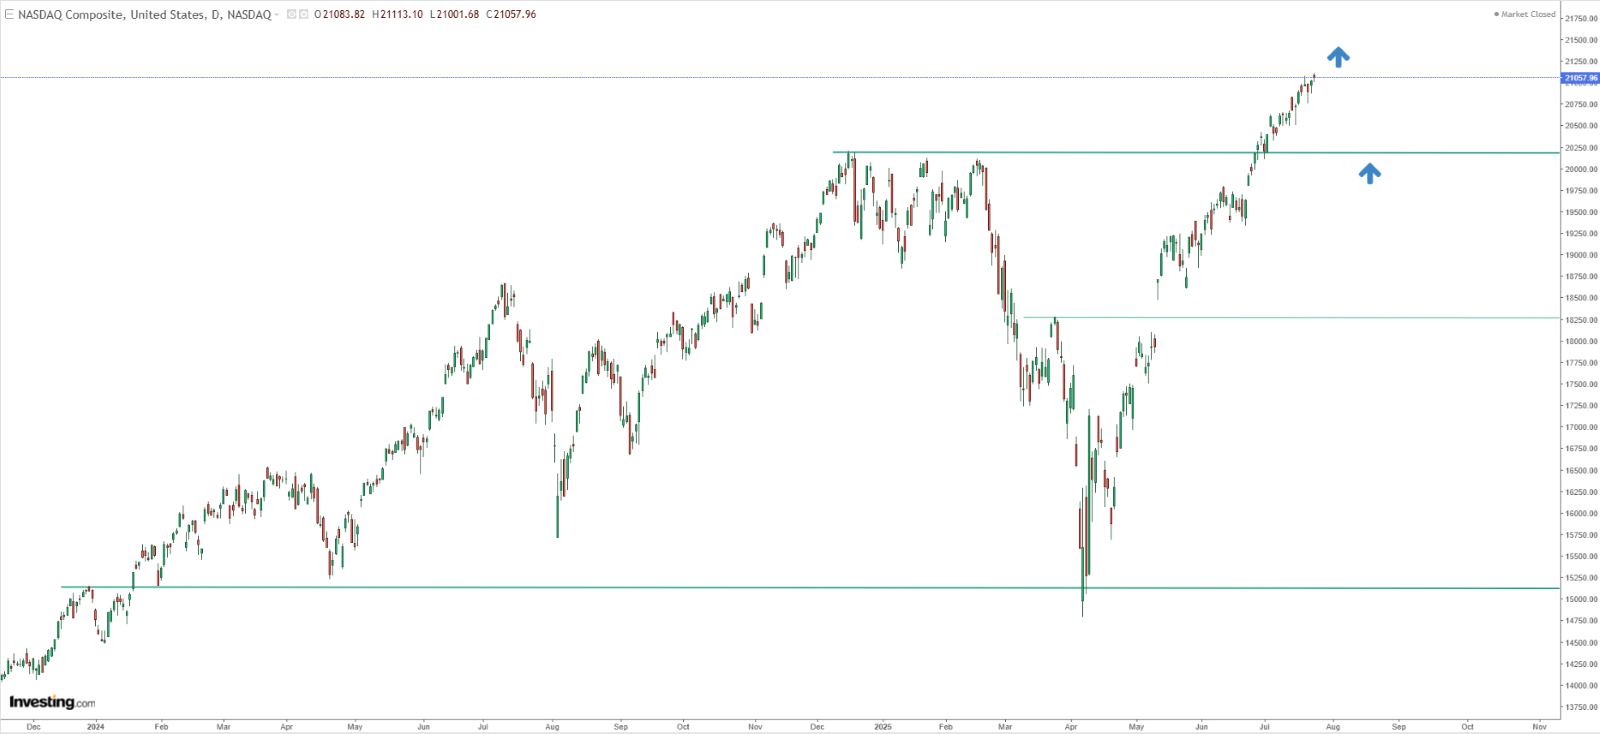
In situations like this, a market correction is usually a good chance to buy at a better price. However, demand has been so strong that there has been almost no pullback since April. If a correction does happen, investors should watch the key support level just above 20,000 points, which was set by earlier record highs.
Clean Uptrend Signals Strength in S&P 500
The S&P 500 is a good example of a classic uptrend. Buyers have already held the index above the 6,300 level, and signs suggest they may try to break through 6,400 in the coming days.
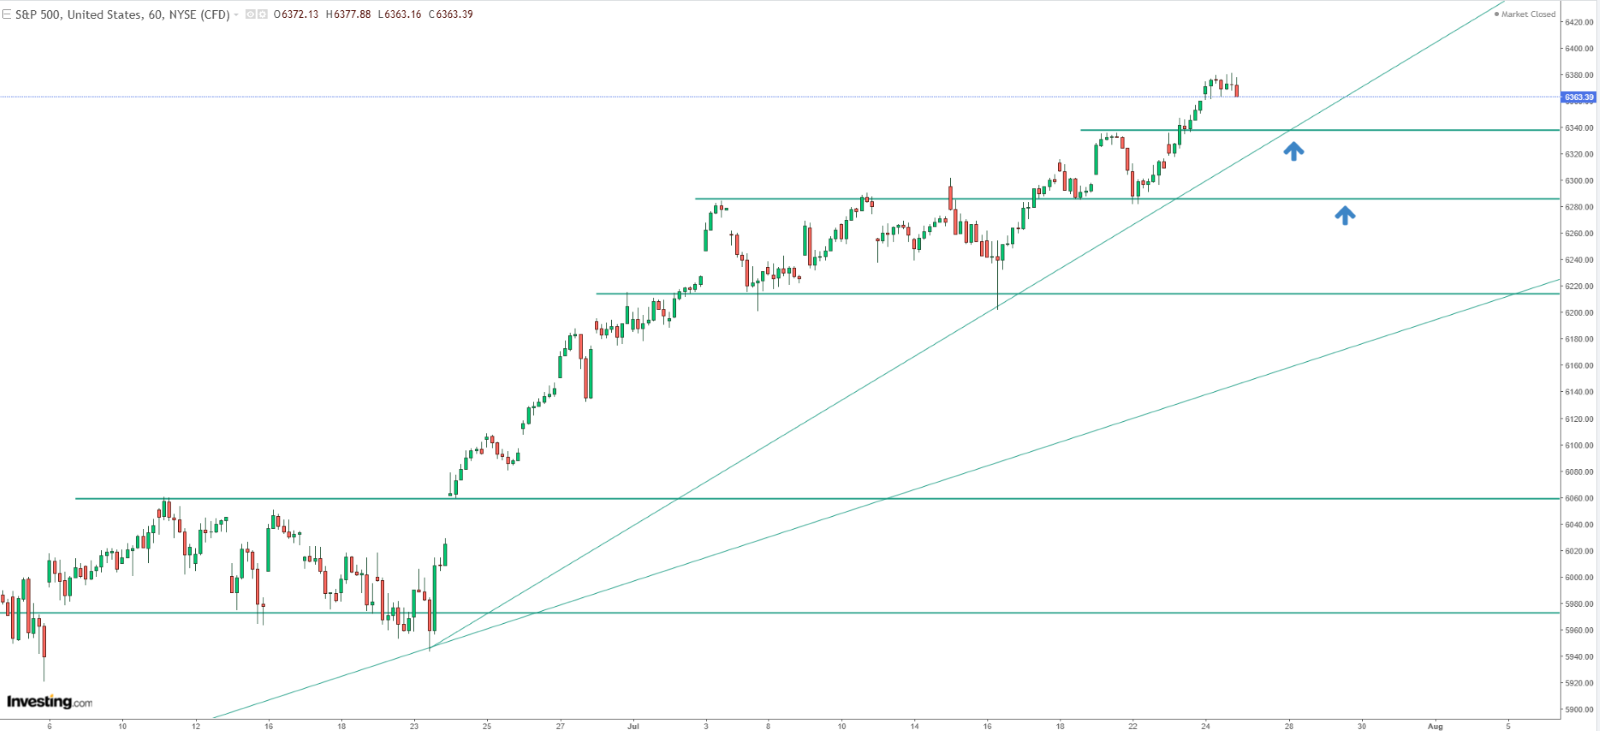
If a short-term correction does happen, the area around the rising trendline and the 6,340 support level could be a tough spot for sellers to break. If this zone is breached, the next potential support levels would likely be below 6,300 points.
DAX Consolidation Hints at Further Upside
After the unsuccessful attempt to break through the support level located in the price area of 24000 points, the most important German stock index fell into a period of consolidation. According to the current direction, the greater probability stands on the side of the continuation of the movement in the northern direction, which is associated with the breakout of the recent maxima falling in 24600 points.
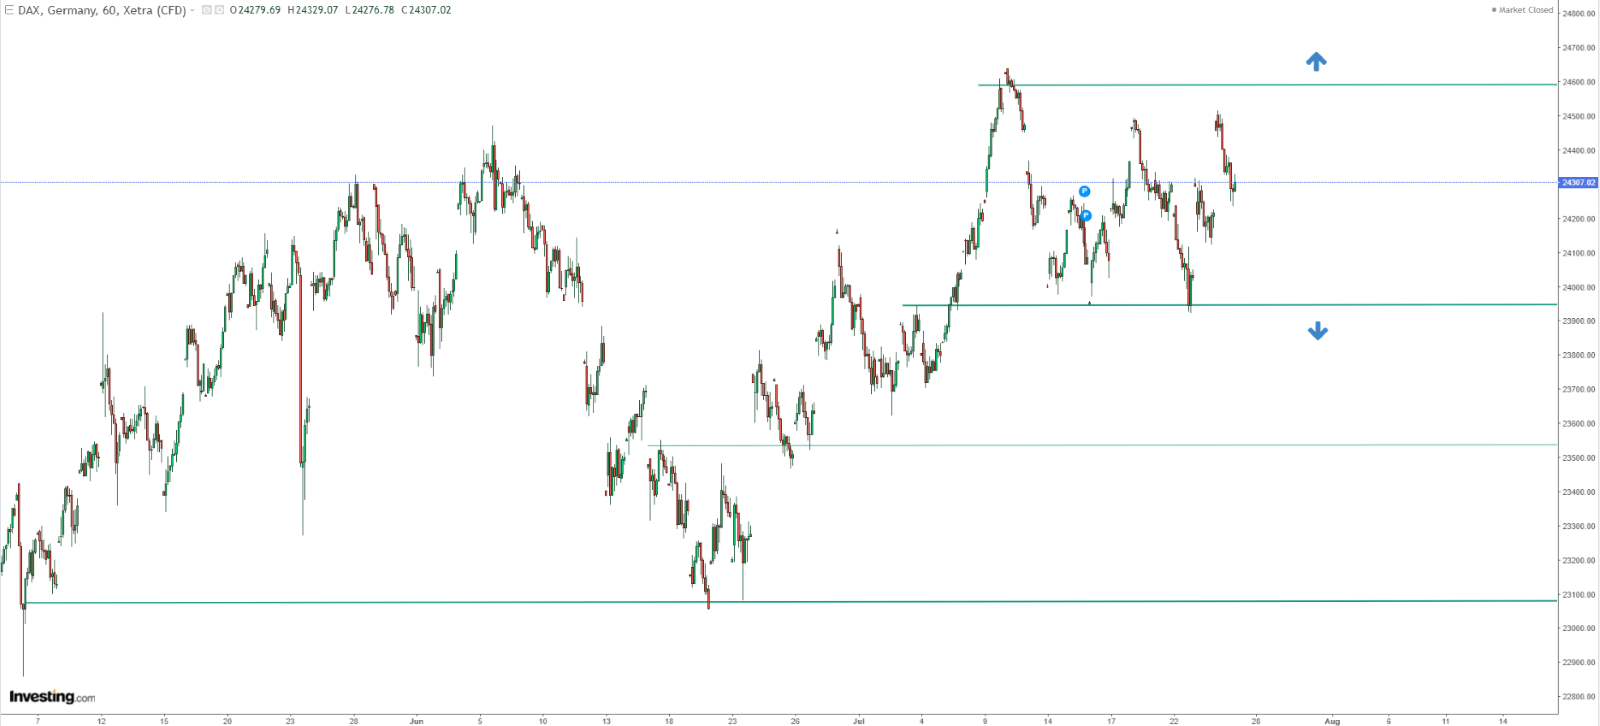
In a similar scenario, the key level to watch is the previously mentioned support. If that level is broken, it could lead to a deeper correction, with the first target around 23,500 points.
****
Whether you’re a novice investor or a seasoned trader, leveraging InvestingPro can unlock a world of investment opportunities while minimizing risks amid the challenging market backdrop.
- ProPicks AI: AI-selected stock winners with proven track record.
- InvestingPro Fair Value: Instantly find out if a stock is underpriced or overvalued.
- Advanced Stock Screener: Search for the best stocks based on hundreds of selected filters, and criteria.
- Top Ideas: See what stocks billionaire investors such as Warren Buffett, Michael Burry, and George Soros are buying.

Disclaimer: This article is written for informational purposes only. It is not intended to encourage the purchase of assets in any way, nor does it constitute a solicitation, offer, recommendation or suggestion to invest. I would like to remind you that all assets are evaluated from multiple perspectives and are highly risky, so any investment decision and the associated risk is at the investor’s own risk. We also do not provide any investment advisory services.