

The correction in continued this week as global macro uncertainty and crypto-driven selling kept pressure on the market. The drop picked up pace after the price slipped under the 100,000 mark and lost support at 99,600. That move pushed Bitcoin quickly below the Fib 0.618 level on the chart.
The current setup points toward the 83,500 to 85,000 zone as a stronger target. This comes from the completion of the head and shoulders pattern and the break of key Fibonacci levels.
Macro Front: Fed Uncertainty and Declining Risk Appetite Pressures Bitcoin
Bitcoin has stayed under pressure in recent weeks because expectations for the Fed have shifted in a meaningful way. Inflation in the US remains above the target and the jobs report released yesterday lowered the odds of a rate cut in December. These developments weighed on crypto and other high-risk assets, and the market’s hope for early easing faded.
The delayed stream of US data after the government shutdown, combined with yesterday’s jobs numbers, added to uncertainty. The unemployment rate came in weaker than expected, which pushed investors away from risk and supported sellers. At the same time, the sharp correction in US tech stocks and talk of new tariffs in US-China relations increased the global risk-off mood.
In this environment, Bitcoin’s sensitivity to macro pressure became clear again, and most of the recent decline was driven by the rise in macro-driven stress.
Crypto Market: ETF Exits, Liquidations and Weak Liquidity Deepen the Decline
Alongside the macro pressure, crypto market-specific factors also pushed the decline. Spot Bitcoin ETFs saw outflows of more than $255 million on November 17, which showed that institutional investors were reducing exposure. These outflows continued for several days and made it harder for the market to find upward momentum.
As the drop gained speed, a wave of leveraged liquidations kicked in and crossed $1.3 billion. This forced the price through key support levels with little resistance. On-chain data showed increased selling from large wallet holders, and shrinking liquidity added to the volatility.
Regulatory uncertainty in the US also weighed on sentiment. The absence of a clear framework and the uncertain outlook for new ETF applications did little to support investors during the decline.
Technical Outlook for Bitcoin
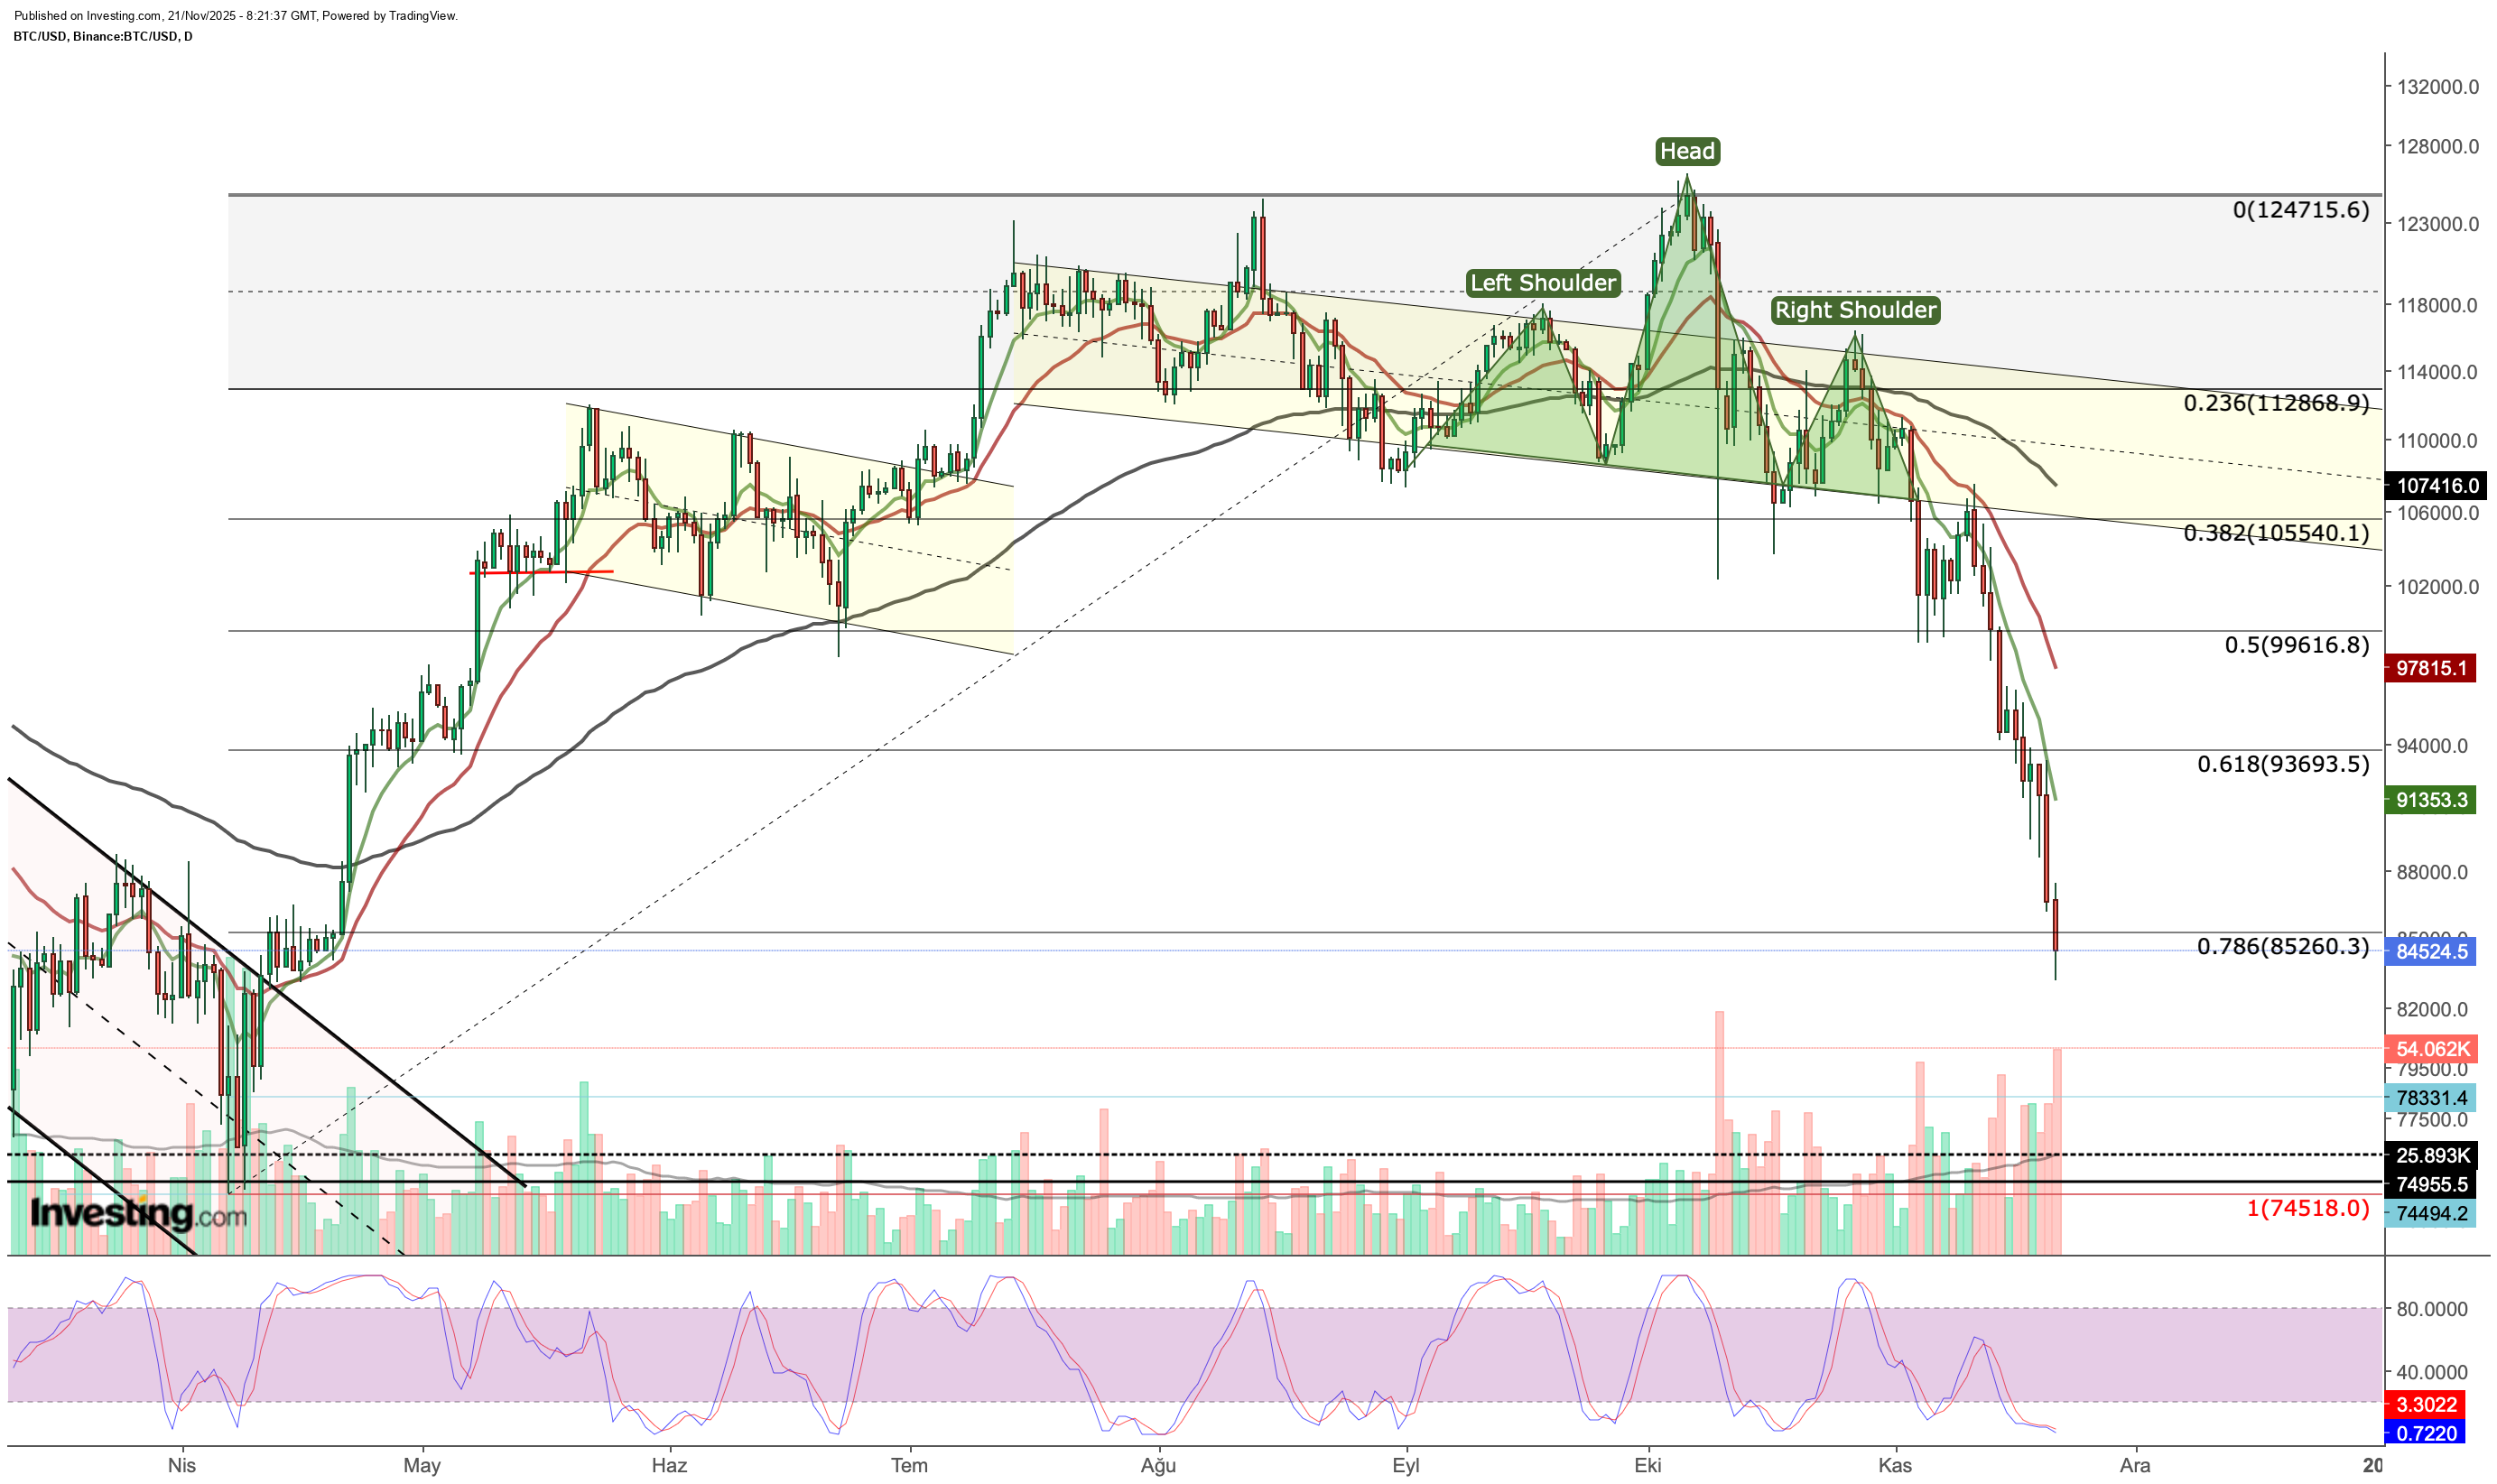
The daily chart shows a Shoulder Over Shoulder pattern that has been in place for a long time and continues to work cleanly. The head formed near $124,000, with the shoulders in the 112,000 to 114,000 band. Once the neckline around 105,500 to 106,000 broke, the back-test move confirmed the sell side and pushed the decline further.
The price then slipped through $99,600 at Fib 0.50 and $93,600 at Fib 0.618, and it is now testing the $85,250 zone at Fib 0.786. This area forms a strong technical cluster because it overlaps with the OBO target and the recently broken support levels.
Short-term EMAs at 8 and 21 have already seen a negative crossover. The price is trading well below both averages, which shows that the downward momentum remains intact. The Stochastic RSI is oversold and flat. This behaviour usually supports continuation during steep drops and does not provide a reliable reversal signal yet.
Weekly Outlook: Searching for New Support After Channel Breakout

On the weekly chart, Bitcoin has now fallen out of the upward channel it has followed since early 2023. After it closed below the Fib 1.618 level at $102,000 earlier this month, the correction picked up speed on a weekly basis. Bitcoin is now testing the $83,500 region, which acted as a key support in March. This is an important support line on the weekly chart, and on the daily chart, it aligns with the Fib 0.786 level.
If the 83,500 to 85,000 zone holds again, the chance of a recovery may improve. For any recovery to continue, Bitcoin will need to build a base above $93,600. Without this, any bounce may stay weak, and the broader decline may continue.
If the current support fails, the downward trend may deepen and push the price toward the $70,000 area. On the weekly chart, the Stochastic RSI is still oversold, although a confirmed bottom is missing because there is no upward crossover yet.
****
Below are the key ways an InvestingPro subscription can enhance your stock market investing performance:
- ProPicks AI: AI-managed stock picks every month, with several picks that have already taken off in November and in the long term.
- Warren AI: Investing.com’s AI tool provides real-time market insights, advanced chart analysis, and personalized trading data to help traders make quick, data-driven decisions.
- Fair Value: This feature aggregates 17 institutional-grade valuation models to cut through the noise and show you which stocks are overhyped, undervalued, or fairly priced.
-
1,200+ Financial Metrics at Your Fingertips: From debt ratios and profitability to analyst earnings revisions, you’ll have everything professional investors use to analyze stocks in one clean dashboard.
-
Institutional-Grade News & Market Insights: Stay ahead of market moves with exclusive headlines and data-driven analysis.
-
A Distraction-Free Research Experience: No pop-ups. No clutter. No ads. Just streamlined tools built for smart decision-making.
Not a Pro member yet?
Already an InvestingPro user? Then jump straight to the list of picks here.

Disclaimer: This article is written for informational purposes only. It is not intended to encourage the purchase of assets in any way, nor does it constitute a solicitation, offer, recommendation or suggestion to invest. I would like to remind you that all assets are evaluated from multiple perspectives and are highly risky, so any investment decision and the associated risk belongs to the investor. We also do not provide any investment advisory services.