

The (DXY) is currently trading around 98.40 as global markets turn their attention to today’s highly anticipated release of the U.S. (CPI) at 3:30 PM Riyadh time (08:30 AM ET). This report is considered one of the most influential economic data for the Federal Reserve when determining its monetary policy path.
Market expectations point to an increase in the annual headline from 2.7% to 2.8%, indicating that inflationary pressures remain persistent despite recent signs of economic cooling. Meanwhile, the (excluding food and energy) on a monthly basis is forecast to rise from 0.2% to 0.3%, a reading closely monitored by the Fed as it reflects underlying price trends without the volatility of energy and food costs.
This release today will have greater significance in light of the disappointing U.S. jobs report from two weeks ago, which revealed a sharp slowdown in hiring alongside one of the largest downward revisions to previous figures since the pandemic. The data fueled speculation that the Fed might pivot toward easing policy sooner rather than later, with Fed funds futures now pricing in roughly an 85% probability of a in September. However, the picture is complicated by growing concerns over stagflation, which is a scenario of stubborn inflation paired with slowing growth. This is why, if today’s CPI readings, particularly the core measure, come in hotter than expected, they could challenge the Fed’s ability to cut rates aggressively without risking inflation getting out of control. Conversely, a softer print would likely reinforce market expectations for imminent policy easing, putting further pressure on the dollar and potentially igniting rallies in risk-sensitive assets.
Gold Holds Ground Ahead of CPI: Technical Picture Remains Resilient
Since the beginning of 2025, has been one of the standout performers, climbing roughly 27% in the first half of the year, supported by a combination of weakness, rangebound Treasury yields, and heightened geopolitical uncertainty. After the May CPI release came in softer than expected, gold prices saw a modest rise as investor sentiment improved and bond yields fell. Ahead of the July CPI, the metal maintained modest intraday gains, buoyed by expectations of a Fed rate cut and subdued demand for the U.S. dollar.
On the daily chart, gold is currently trading around $3,353, hovering just above the 20-day EMA at $3,355 and comfortably above both the 50-day EMA ($3,334) and the 100-day EMA ($3,282), reflecting a still-positive medium-term trend despite the recent sideways movement. The Bollinger Bands are relatively narrow, indicating a period of reduced volatility, with price action leaning toward the upper band, suggesting a mild bullish bias if momentum strengthens. The MACD line remains above the signal line, though both are close to the zero mark, signaling modest bullish momentum but with no strong acceleration. The RSI stands near 50.48, reflecting a neutral stance and leaving room for movement in either direction without being in overbought or oversold territory.
Key support levels are seen at $3,334 (50-day EMA), followed by $3,282 (100-day EMA), and then $3,253 (late-June swing low). On the upside, major resistance is located at $3,356 (20-day EMA and upper Bollinger Band area), followed by $3,431 (mid-May peak zone), and then $3,500 as a psychological and historical barrier.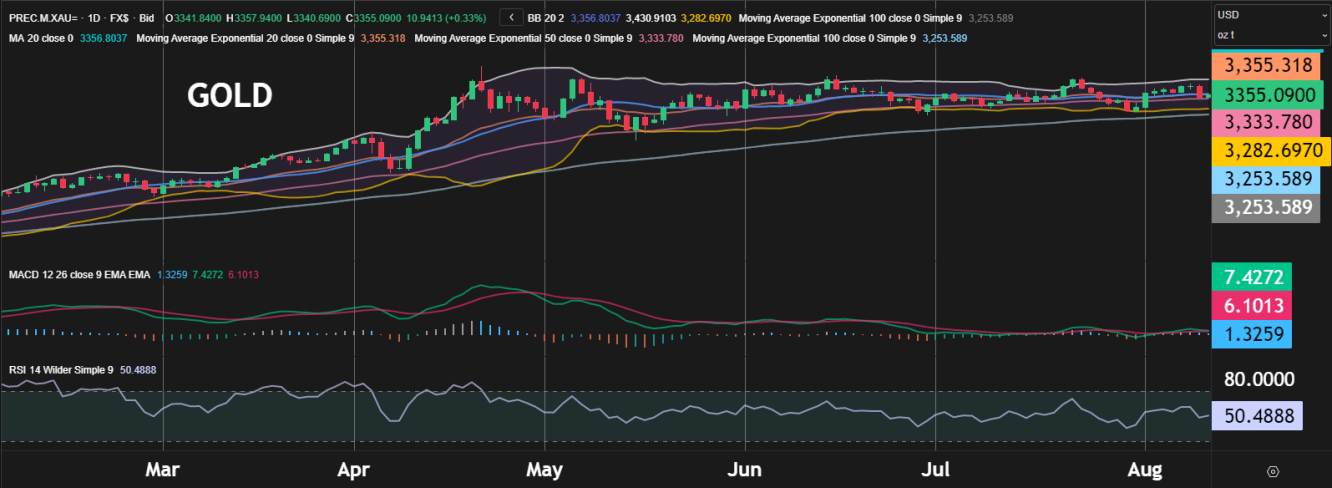
EUR/USD Maintains Bullish Bias as Markets Await Inflation Clues
On the other hand, has generally strengthened when CPI readings have surprised to the downside, weakening the dollar. April’s softer-than-expected CPI, for example, prompted a decline in the greenback, allowing the euro to appreciate while U.S. stock futures moved higher. Ahead of today’s data, the pair is trading near 1.1650, with traders closely watching the release for fresh clues on Fed policy; a stronger-than-expected CPI could push the euro below 1.1500, while a softer print might revive upward momentum.
On the daily chart, EUR/USD is trading around 1.1610, slightly below the 20-day EMA at 1.1622, and above both the 50-day EMA (1.1570) and the 100-day EMA (1.1400). This alignment reflects that the broader trend remains bullish despite recent consolidation. The Bollinger Bands have narrowed, indicating lower volatility, with price currently positioned near the mid-to-upper band, suggesting a mild bullish bias if buying momentum builds. The MACD line is hovering just above the signal line, close to the zero axis, signaling that bullish momentum is present but still weak. The RSI is at 50.48, indicating a neutral market stance with room to trend higher or lower without being in overbought or oversold territory.
Major support levels are seen at 1.1570 (50-day EMA), followed by 1.1430 (lower Bollinger Band and late-May support area), and 1.1400 (100-day EMA and psychological round number). On the upside, resistance is at 1.1622 (20-day EMA and recent consolidation cap), followed by 1.1700 (psychological barrier and late-July peak), and 1.1800 (upper Bollinger Band breakout zone).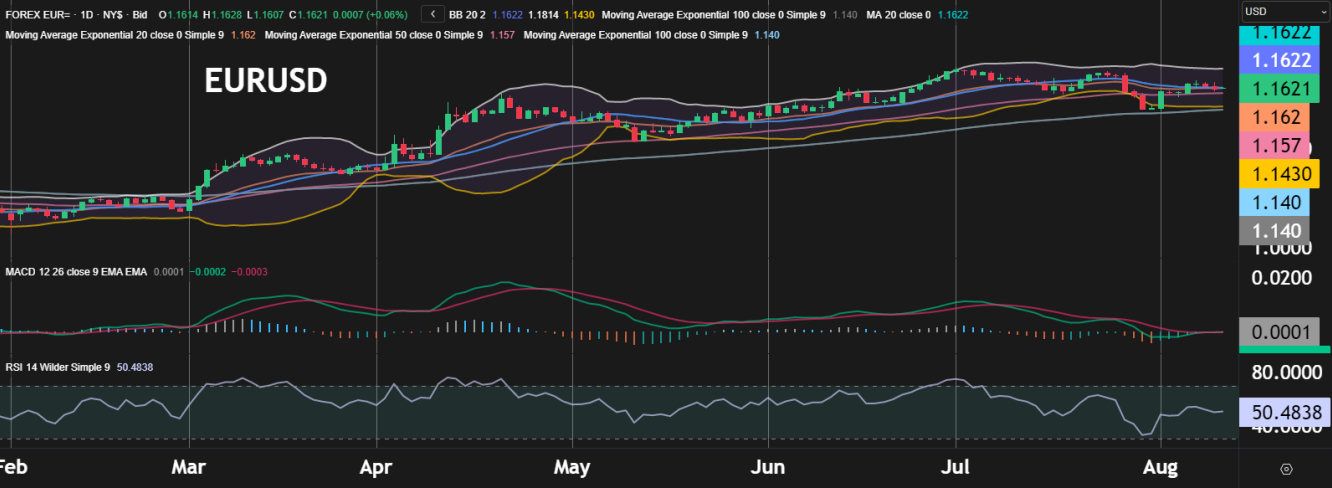
These historical patterns underline why today’s release could spark significant volatility. A higher-than-expected CPI is likely to push the dollar higher and weigh on gold, the euro, and the other major currencies, while a softer reading could deliver the opposite effect. Given the combination of fragile growth, persistent inflation pressures, and heightened geopolitical and trade tensions, this CPI release may prove one of the most market-moving events of the month, especially that all eyes will be on the Federal Reserve rate decision in September. Traders are advised to approach the session with disciplined risk management, using appropriate position sizing, stop-loss orders, and close monitoring of market reactions in the crucial first minutes after the data hits the wires.