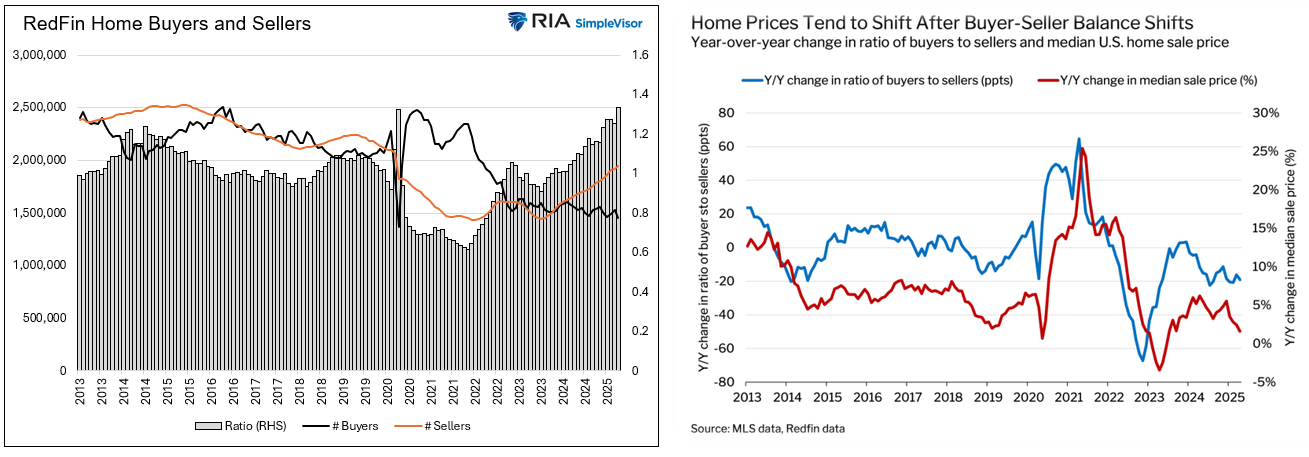
The following commentary is from Redfin (NASDAQ:): “There are 34% more sellers in the market than buyers. At no other point in records dating back to 2013 have sellers outnumbered buyers this much. In other words, it’s a buyer’s market. Redfin expects home prices to drop 1% by the end of the year as a result. Prospective buyers may see their purchasing power increase, and prospective sellers should consider selling sooner rather than later.”
The graphs below help appreciate the mismatch of sellers and buyers and the impact it can have on house prices. The graph on the left shows that the number of sellers has been steadily increasing over the past two years, while the number of buyers has been slowly declining. Consequently, the ratio of sellers to buyers (represented by the grey bars) is now at a record high, dating back to 2013.
The graph on the right illustrates a strong correlation between the ratio of buyers to sellers and changes in home prices. As RedFin notes in the title of the graph, “Home prices tend to shift after buyer-seller balance shifts.“
The RedFin data further confirms our prediction that shelter prices could fall sharply. To wit, we share a bit of our Commentary from last week:
We have often discussed the outsized role that rent and implied rental prices, i.e., shelter prices, play in the Consumer Price Index (CPI) data. CPI may be much lower in the coming months when lagging CPI shelter prices catch up to market prices and fundamentals.
What To Watch Today
Earnings
Economy
Market Trading Update
how the recent push higher in the market is turning the weekly sell signals back toward buy signals, which is bullish for the markets. Furthermore, Michael touched on the statistics for selling in May. Focusing on the short term, the market started the month of June on a good note with a persistent rally yesterday.
Mike’s note yesterday sparked several emails as assumed that investors buy January 1st and sell in May. There is another version that many have asked about.
After a powerful May, what does June’s stock market performance tend to look like? Historical data for the S&P 500 (since 1950) shows that June is typically a seasonally weak month—a key piece of the adage “Sell in May and go away.” That adage is a centuries-old market maxim rooted in the observation that stock market returns tend to be weaker during the summer months (May through October) compared to the “seasonally strong months” of November through April.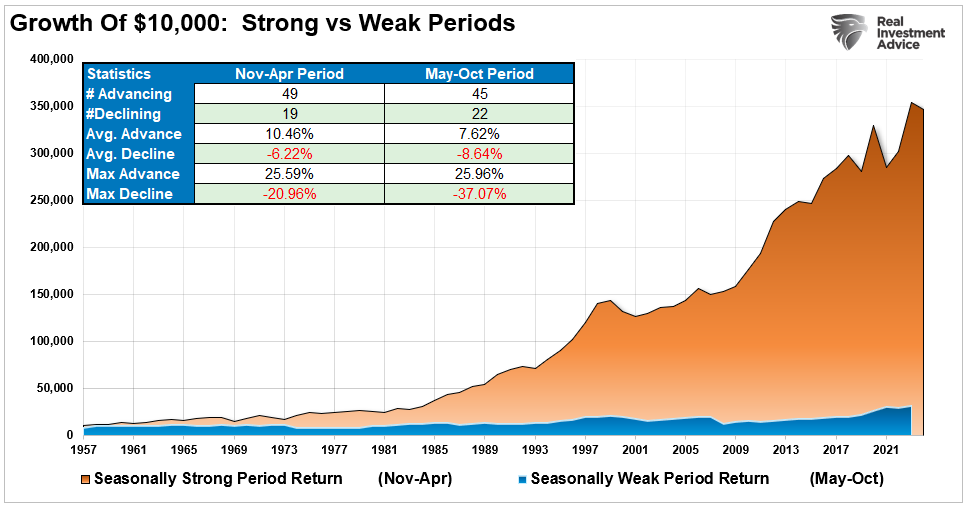
Since 1950, the ’s average returns from May through October have been considerably lower (about 1–2% total gain) than those from November through April (about 6–7% gain). This disparity is attributed to factors such as lower trading volumes, mid-year economic slowdowns, and investors taking summer vacations.
However, investors shouldn’t take “sell in May” as rigid investment advice. Modern market dynamics, global trading, and technological advancements have diluted some of its relevance. However, it serves as a reminder of seasonal market patterns and the importance of vigilance during traditionally sluggish months.
Historically, June has been one of the weakest months for U.S. equities. Since 1950, the S&P 500’s average June stock market performance is roughly flat – about 0.1% gain on average (and a similar 0.1% median gain), with just over half of all Junes finishing positive. June ranks as the second-weakest month for the market (only September has been worse), with an average June return of only about 0.06% since 1957.
This tepid performance helps explain the saying “sell in May,” as the early summer often brought lackluster returns.
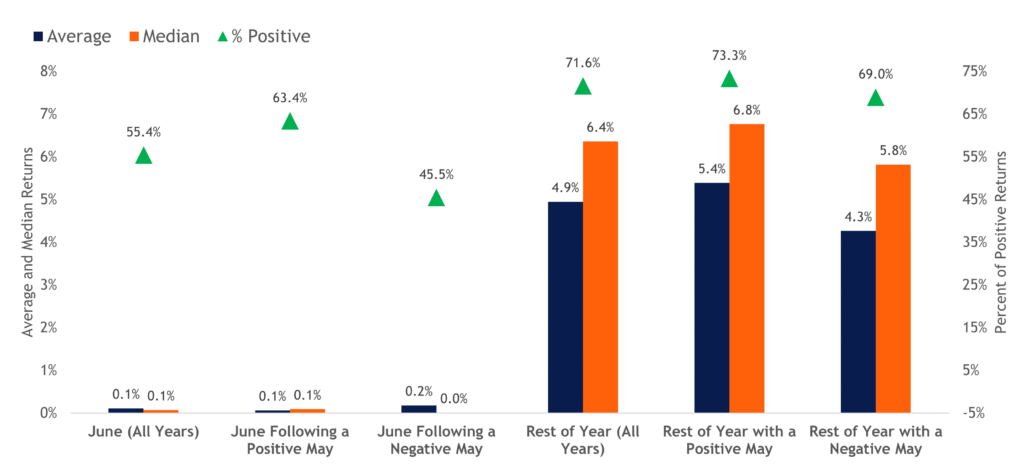
However, recent decades have shown that June isn’t always a loser. The S&P 500 rose in 12 of the past 20 June months (and 8 of the past 10), though the gains in those positive Junes were usually modest. Seasonality is a tendency, not an ironclad rule. One crucial factor is whether May’s performance was strong.
A big rally in May can signal momentum carrying into June. Historically, after the S&P 500 gains 5% or more in May, June has been positive five out of six times, averaging about a +1.2% return – a nice improvement over the typical ~0%.
An Imbalance In The Condo Market Too
More from RedFin:
There are an estimated 259,137 condo sellers in the U.S. housing market and an estimated 141,223 condo buyers. In other words, there are 83.5% more condo sellers than buyers.
Because there are so many more condo sellers than buyers, condo prices have been underperforming single-family home prices, and in some markets, falling or even plummeting (think Florida). The median U.S. condo sale price rose 0.4% year over year in April, compared with a 1.5% gain in single-family-home prices.
Part of CPI shelter prices is rent. As condo prices come under pressure, rental prices of said condos are likely to follow. Unless mortgage rates decline, the imbalance of sellers and buyers in the housing and condo markets is likely to result in disinflation in those markets. The result will be the eventual decline in CPI shelter prices and the outsized impact it will have on CPI.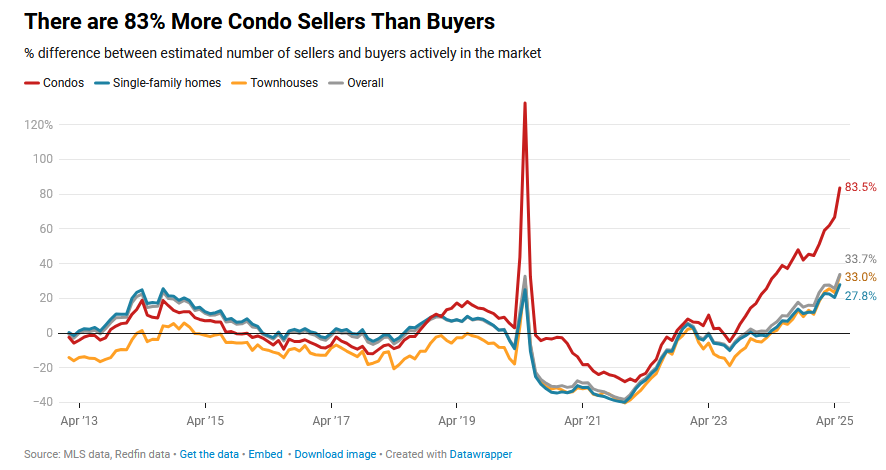
Tweet of the Day