

-
Bitcoin broke above $120,000 this week, gaining 7% and ending its bearish trading phase.
-
Heavy inflows into spot ETFs and rising institutional interest continue to support Bitcoin’smomentum.
-
Technical outlook shows potential pullback to $116,500 before testing higher targets near $125,500–$132,000.
- Looking for actionable trade ideas to navigate the current market volatility? Subscribe here to unlock access to InvestingPro’s AI-selected stock winners.
surpassed a critical resistance point in this week’s bullish trend and strengthened the market outlook by surpassing the $120,000 level again after weeks. The cryptocurrency, which recorded a value increase of up to 7% on a weekly basis, thus made an important move to overcome the bearish consolidation phase.
A positive atmosphere has emerged in the crypto markets due to both the uncertainties in global markets and the increase in institutional demand for crypto assets. In particular, inflows into spot ETFs and investors’ shift towards alternative assets are among the main factors supporting Bitcoin’s recent momentum.
ETF Inflows Support Bitcoin
The most notable development in the crypto asset markets in recent days has been the strong inflows into spot Bitcoin ETFs. Billions of dollars of capital flowed in just a few days. This signals a renewed appetite for risk, especially among large funds and institutional investors. In the face of uncertainties in traditional markets, the shift towards crypto assets continues to be a key driver for Bitcoin.
Another development that supports Bitcoin in general is the acceleration of stablecoin integrations by corporates. Stable crypto adoption is building a solid bridge between the crypto industry and traditional finance. This suggests that Bitcoin, the dominant crypto asset in the market, may play a more important role in global payment systems and financial infrastructures in the future.
Political Uncertainty Supports Crypto Outlook
The US federal government shutdown led to a deterioration in risk sentiment. The possibility that official economic data would not be released during the week left markets with difficulties in forecasting, while investors continued to turn to safe-haven assets. In this process, the US dollar remained under pressure while gold continued its peak discovery. Bitcoin also took its place among the prominent alternative assets.
Prolonged uncertainties will be a factor that increases downside risk to growth. In such a scenario, we can see that Bitcoin can differentiate itself from traditional markets and attract more capital. This is because investors may accelerate their shift towards crypto assets by increasing their demand for alternative investments as political stalemates and the prospects of quantitative easing grow stronger.
Another factor that has come to the fore recently is the expectations for US monetary policy. Following the slowdown in the labor market, are expected to continue for the rest of the year. Such a scenario would mean continued pressure on the US dollar and could create a new wave of demand for Bitcoin. The easing of global liquidity conditions has the potential to increase interest in risky assets.
Bitcoin’s recent rally broke a critical psychological level above $120,000, rebuilding market confidence. Institutional inflows, political uncertainties, and stand out as the key dynamics behind this trend. The duration of the shutdown and new signals regarding monetary policy will continue to be decisive for pricing in the coming period.
Bitcoin’s Technical Outlook
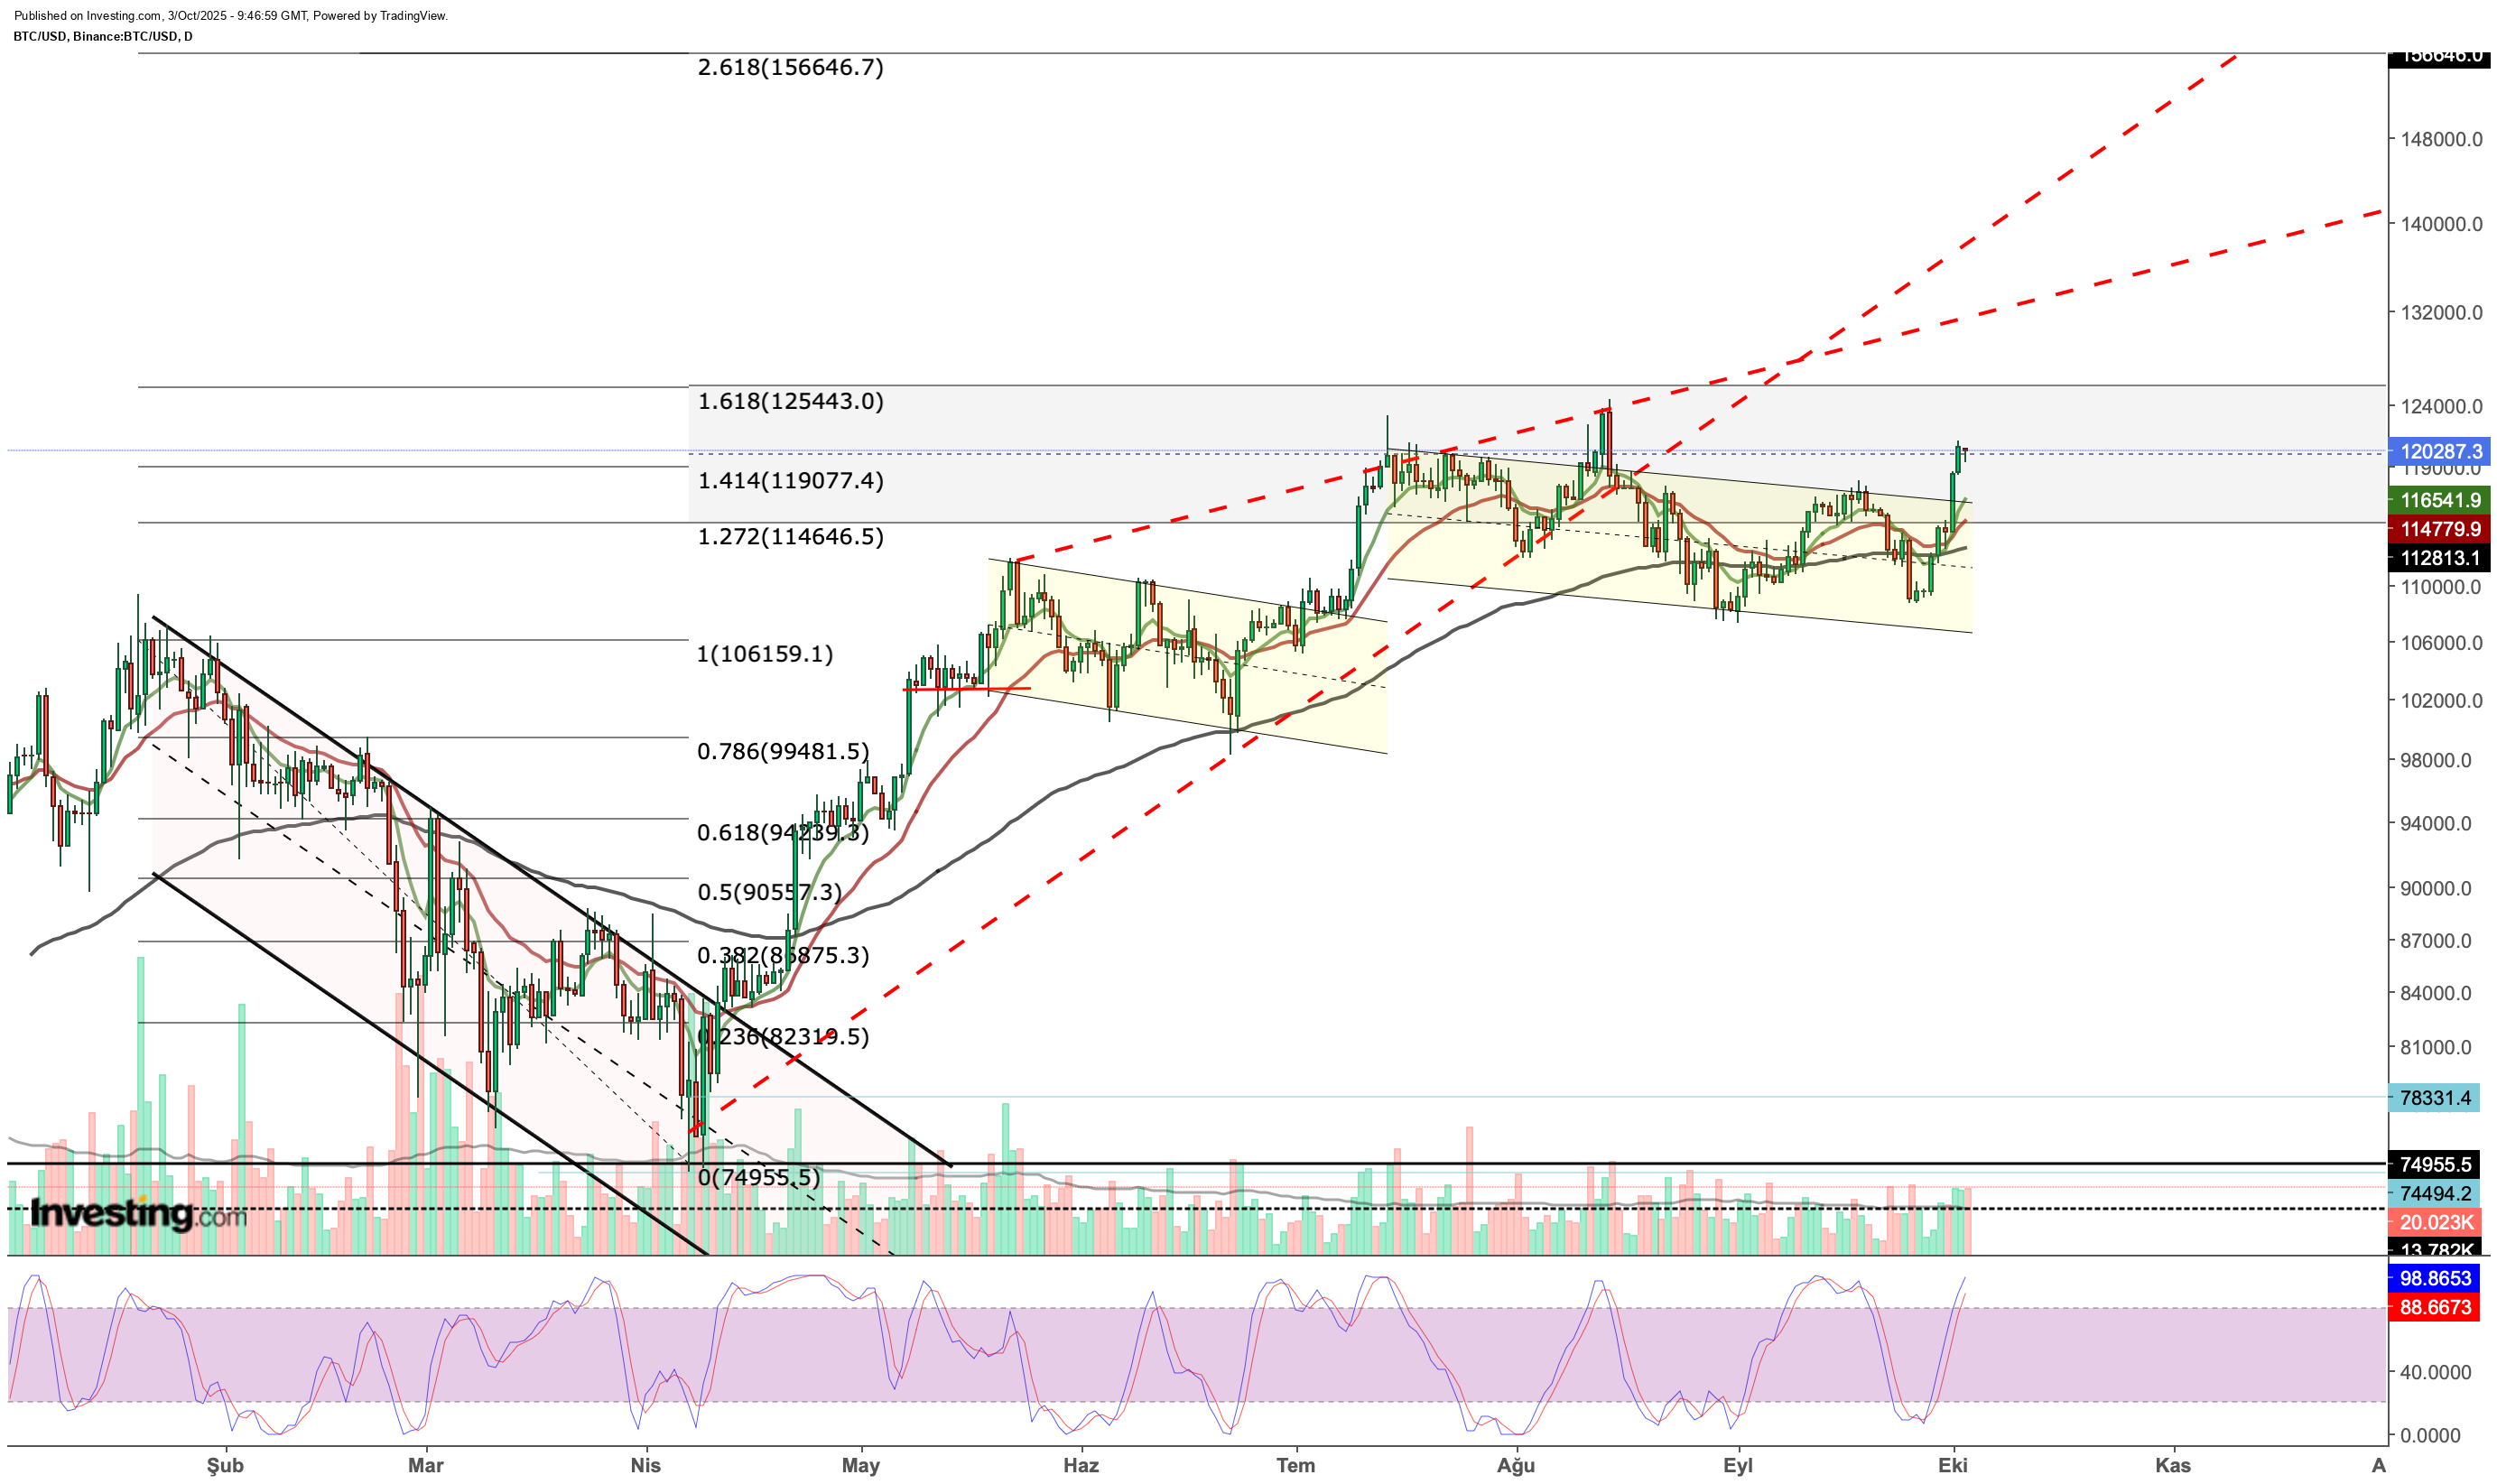
In a positive trend that continued throughout the week, Bitcoin increased its momentum in the second half of the week and broke the bearish channel we have been tracking since July to the upside. Similar momentum was seen in mid-August, but the backtest towards the upper line of the channel failed at that time, and the Bitcoin price returned to the channel movement.
This week’s breakout could be similar. Bitcoin is overbought in the short term. The next move could be a retest back towards the upper band of the channel. This may appear as a retreat towards an average of $ 116,500. If this level is maintained in a possible correction, the trend may strengthen.
Thus, after the voluminous break of the current resistance zone of $119,000-120,000, a test of $125,500, the upper limit of the Fibonacci expansion zone, may come to the agenda. Exceeding this level could trigger a rise towards the $132,000 band in the last quarter.
In the lower region, if the $116,500 support is lost in the event of a possible back test, Bitcoin will return to the channel. In this case, an acceleration towards $111,000 and then the risk of a decline towards the $105,000 region, which coincides with the lower band of the channel, may come to the fore.
****
InvestingPro provides a comprehensive suite of tools designed to help investors make informed decisions in any market environment. These include:
- AI-managed stock market strategies re-evaluated monthly.
- 10 years of historical financial data for thousands of global stocks.
- A database of investor, billionaire, and hedge fund positions.
- And many other tools that help tens of thousands of investors outperform the market every day!
Not a Pro member yet? Check out our plans here.
Disclaimer: This article is written for informational purposes only. It is not intended to encourage the purchase of assets in any way, nor does it constitute a solicitation, offer, recommendation or suggestion to invest. I would like to remind you that all assets are evaluated from multiple perspectives and are highly risky, so any investment decision and the associated risk is at the investor’s own risk. We also do not provide any investment advisory services.