

After a strong start to October, has come under the influence of profit-taking since the beginning of the week, becoming stuck in the critical resistance zone. Although the market has remained bearish throughout the week, the fundamental support for Bitcoin remains strong.
The acceleration of institutional inflows into spot ETFs, the increasing accumulation tendency of long-term investors, and macroeconomic indecision stand out as the main factors likely to determine Bitcoin’s direction during this period.
Spot ETF Inflows Confirm Institutional Demand
Bitcoin’s high-volume breakout above the $120,000 resistance in early October showed that institutional demand in the market remains strong. Net ETF inflows of $2.2 billion were recorded — the second-largest weekly inflow of all time. These large inflows put upward pressure on the price by reducing supply in the spot market.
A similar trend occurred during the same period last year, with Bitcoin gaining more than 50%. Historically, the fourth quarter has been one of the strongest periods for Bitcoin, fueling market perception that institutional flows may positively affect pricing. Additionally, the continued accumulation by mid-sized Bitcoin holders — along with large investors — signals further bullish expectations. Beyond whales, the efforts of smaller BTC holders to increase their holdings is an important development, as it indicates capital is continuing to flow toward the broader base. This supports a more sustainable continuation of the Bitcoin trend.
Macro Balances: Strong Dollar and Changing Risk Perception
On the macroeconomic front, the picture remains mixed. According to the latest New York Fed survey, 1-year-ahead rose to 3.4%, the highest in 3.5 years. This increase signals that the Fed’s expected — projected to continue through 2026 — may be delayed. While the ongoing US federal government shutdown limits available data, what data is available has been effective in shaping market pricing. For example, the dollar has strengthened in recent days amid these expectations, placing short-term pressure on crypto assets, especially Bitcoin. Additionally, high valuations in equity markets are prompting investors to be more cautious in riskier assets.
When the Dollar Weakens, Bitcoin May Regain Momentum
Although demand for the dollar remains strong in the short term, expectations for this momentum to extend over the long term are weak. Accordingly, developments that could lead to a loss of confidence in the dollar may act as a bullish catalyst for Bitcoin. Meanwhile, increased profit-taking in — which has recently hit record highs — could also benefit Bitcoin. Given gold’s bullish performance this year, there are comments suggesting Bitcoin remains relatively undervalued. This strengthens the view that a possible pullback in gold could present a new buying opportunity for Bitcoin.
Technical Outlook for Bitcoin
Bitcoin appears to be in a technical decision phase in recent days. After the cryptocurrency moved above $120,000, it failed to break through resistance around the $125,000 band due to a loss of momentum.
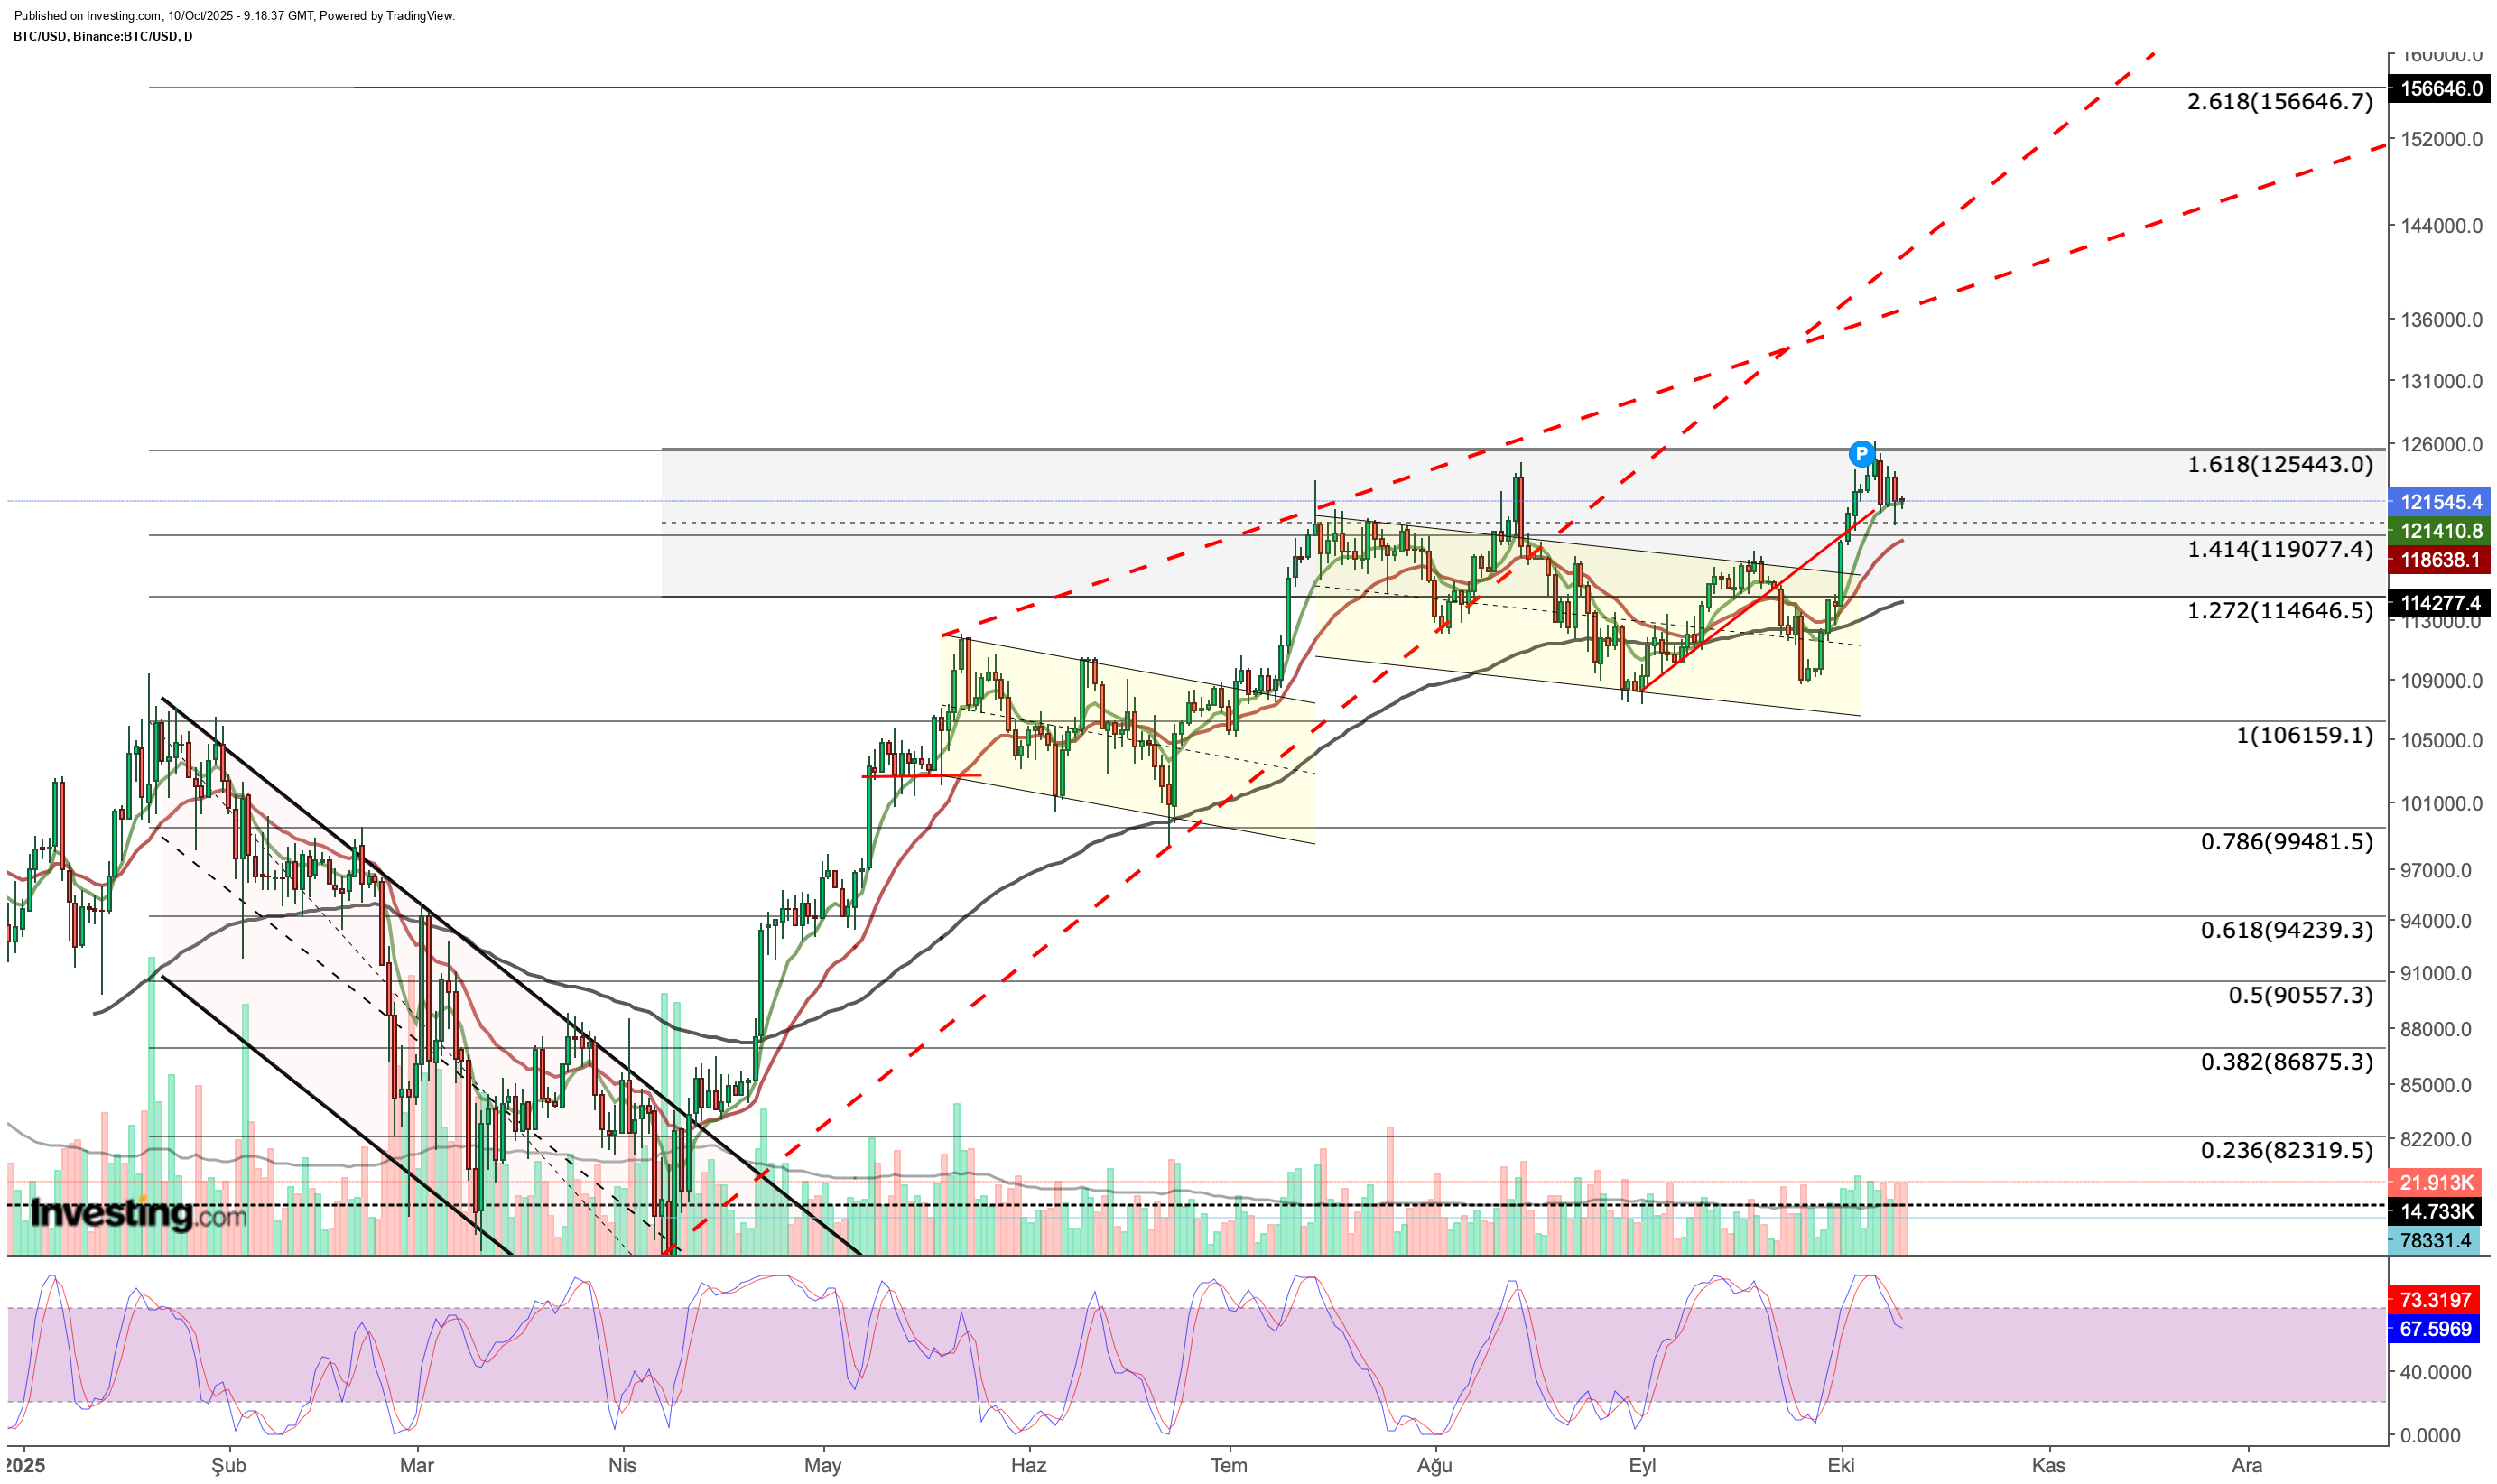 Currently, Bitcoin is trying to hold the support level around the $120,300 region. In the short term, it faces strong resistance near the $122,000 average. If the price continues to remain in the $120,000–$122,000 band in the coming days, it would indicate ongoing consolidation. However, this tightening is likely to lead to a breakout. A high-volume breakout above the $122,000 resistance could open the way for a new upward wave. In this scenario, the $125,500 level could be the first target, followed by a potential new peak in the $130,000–$135,000 region.
In the downside scenario, if the price dips below $120,300, the $119,000 level is critical support. If this is lost, selling pressure may accelerate, with the price likely to retreat to the $114,000–$116,000 band. In the case of a deeper correction, the $106,000–$111,000 range may come into play.
Technical indicators currently show weakening short-term momentum for Bitcoin. The Stochastic RSI on the daily chart is starting to slope downward from the overbought zone, making the support line down to $119,000 more important.
However, if institutional buying and accumulation data remain strong, this may be seen as a healthy consolidation period before the next upward move.
****
InvestingPro provides a comprehensive suite of tools designed to help investors make informed decisions in any market environment. These include:
- AI-managed stock market strategies re-evaluated monthly.
- 10 years of historical financial data for thousands of global stocks.
- A database of investor, billionaire, and hedge fund positions.
- And many other tools that help tens of thousands of investors outperform the market every day!
Not a Pro member yet? Check out our plans here.
Disclaimer: This article is written for informational purposes only. It is not intended to encourage the purchase of assets in any way, nor does it constitute a solicitation, offer, recommendation or suggestion to invest. I would like to remind you that all assets are evaluated from multiple perspectives and are highly risky, so any investment decision and the associated risk belongs to the investor. We also do not provide any investment advisory services.