

US CPI Key Points
- US CPI came in a tick below expectations at 0.2% m/m (2.3% y/y) vs. 0.3% (2.4%) eyed.
- Core CPI was 0.2% m/m (2.8% y/y) vs. 0.3% m/m (2.8% y/y) anticipated.
- USD/JPY is showing near-term bullish consolidation, potentially setting the stage for a continuation above 149.00 in the coming days.
The just-released US showed that US consumer prices rose less than expected in April, marking the smallest annual increase since February 2021.
The CPI increased by 0.2% month-over-month and increased 2.3% year-over-year, slightly below forecasts. , excluding volatile food and energy prices, also rose by 0.2% m/m and rose 2.8% y/y, aligning closely with expectations.
In terms of the details of the report, significant price declines were seen in several categories, particularly groceries, which dropped 0.4%, the largest decline since September 2020. Notably, egg prices plummeted by 12.7%, the steepest monthly decrease since 1984, reflecting relief from earlier avian flu-induced hikes. Airfares fell by 2.8%, and lodging prices dipped slightly by 0.1%, signaling a potential slowdown in travel demand. Apparel costs also saw a modest decrease of 0.2%.
However, shelter continued to drive overall inflation, rising 0.3% and accounting for more than half of the total CPI increase. Energy prices edged up 0.7%, despite a 0.1% adjusted drop in gasoline prices. Motor vehicle insurance increased notably by 0.6% month-over-month and 6.4% year-over-year.
The report suggests minimal immediate impact from April’s “Liberation Day” tariffs from the Trump administration, though inflationary effects could intensify in the coming months as pre-tariff inventories are depleted.
Given the mostly as-expected reading and uncertainty around the impact of tariffs, the is likely to leave unchanged in the near term, with the CME’s FedWatch tool suggesting less than 40% odds of an interest rate cut before September.
Japanese Yen Technical Analysis: USD/JPY Daily Chart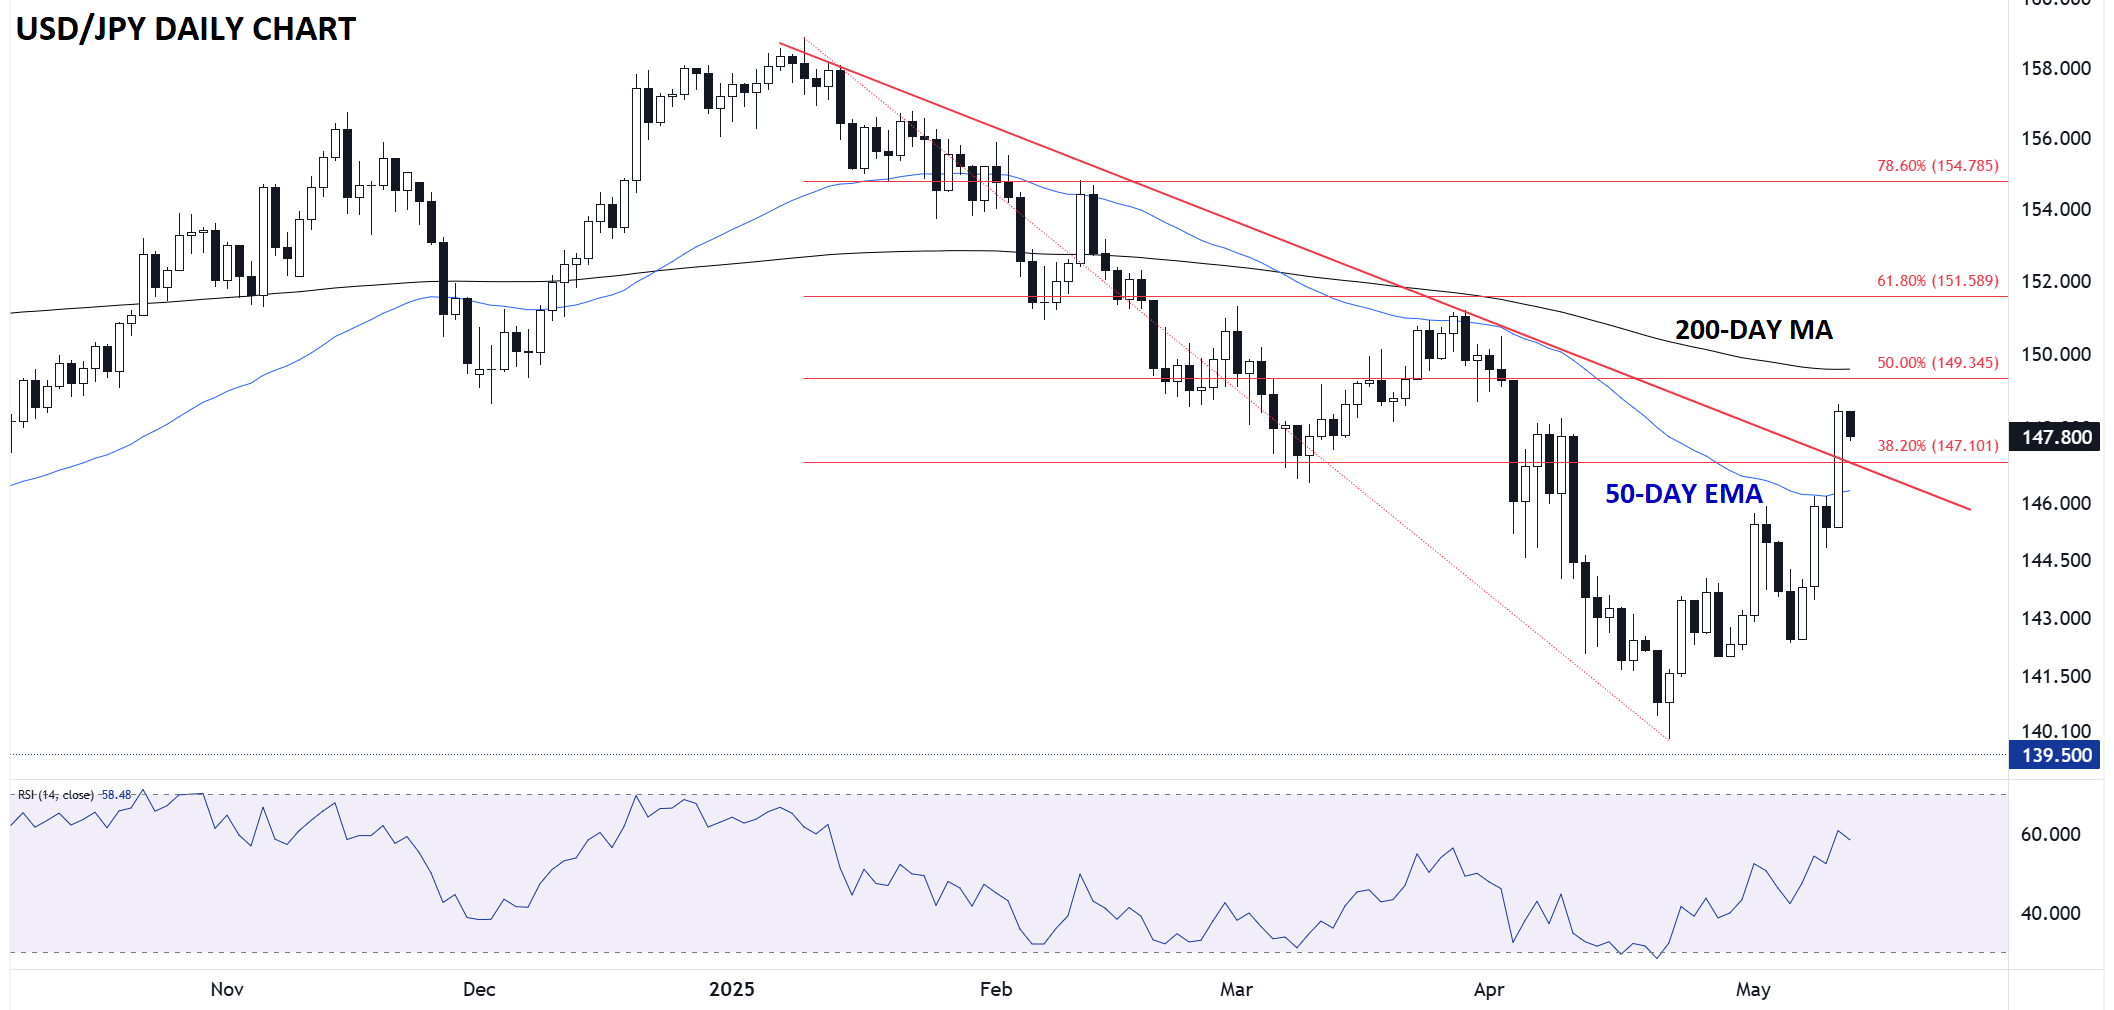
Source: TradingView, StoneX
Turning our attention to the forex market, is consolidating after yesterday’s big tariff truce surge through resistance at the 50-day EMA and 38.2% Fibonacci retracement. The (so far) small range near the top of yesterday’s big candle is sign of bullish consolidation from a near-term perspective, potentially setting the stage for a continuation higher in the latter half of the week.
To the topside, the next levels of resistance to watch are the 50% Fibonacci retracement near 149.35, followed by the 200-day MA closer to 150.00. Meanwhile, any pullbacks may find support on the topside of the broken bearish trend line near 147.00. Only a break below that area would erase the near-term bullish bias.