

- Ceasefire and institutional buying slowed crypto’s June decline, boosting and altcoin sentiment.
- Bitcoin dominance hit 65%; a drop below 62% may signal stronger altcoin inflows.
- Ethereum, XRP, and SUI show recovery signs, but key resistance levels must be broken.
- Looking for actionable trade ideas to navigate the current market volatility? Subscribe here to unlock access to InvestingPro’s AI-selected stock winners.
The mood in the cryptocurrency markets turned more positive after news of a ceasefire between Israel and Iran. The steady decline that had continued through June began to slow, helped by a wave of buying after Donald Trump made a statement on social media. Although rising geopolitical tensions had weighed on the market for weeks, some of the losses were limited by institutional investors stepping in to buy.
Most of these large investors focused on buying , which pushed Bitcoin’s market dominance to 65%—its highest level since January 2021. Bitcoin has held up well during this volatile period, staying above $100,000 even at the peak of tensions. The ceasefire brought some short-term relief, and interest in altcoins picked up in the past 24 hours.
However, it is still uncertain whether the ceasefire will last. If geopolitical risks ease further, investors may start paying more attention to other global and domestic factors. This could lead to more money flowing into the altcoin market, which has suffered more during recent weeks of uncertainty.
In the coming days, Bitcoin’s dominance in the market could play a key role in determining the direction of altcoins. If Bitcoin dominance falls below 62%, it may suggest that its recent upward trend is weakening. This could be a signal that more funds will start flowing into altcoins.
At the same time, if geopolitical tensions continue to ease, investors are likely to shift their focus to the . With inflation cooling and job growth slowing in the US, expectations for a possible rate cut in July are growing. If the Fed does lower sooner than expected, it could boost demand for cryptocurrencies.
So far, the Fed has kept a tight policy stance, pointing to risks from trade tariffs. This cautious approach has held back investor appetite for riskier assets like crypto. However, any sign of a softer tone from the Fed could spark a relief rally in the markets.
Even so, geopolitical risks remain, and the global economic outlook is still uncertain. This means market sentiment can shift quickly. In such a fragile environment, crypto investors are likely to stay cautious and watch key support and resistance levels closely.
Following recent developments, there has been a noticeable pickup in buying across the altcoin markets. is attempting to recover this week by climbing back into its previous trading range after breaking below it last week.
briefly dropped below the key psychological level of $2 but quickly bounced back and held above that support. Meanwhile, , known for its sharper price swings, made a strong move this week, putting an end to its six-week correction phase.
Ethereum Nears Critical Resistance
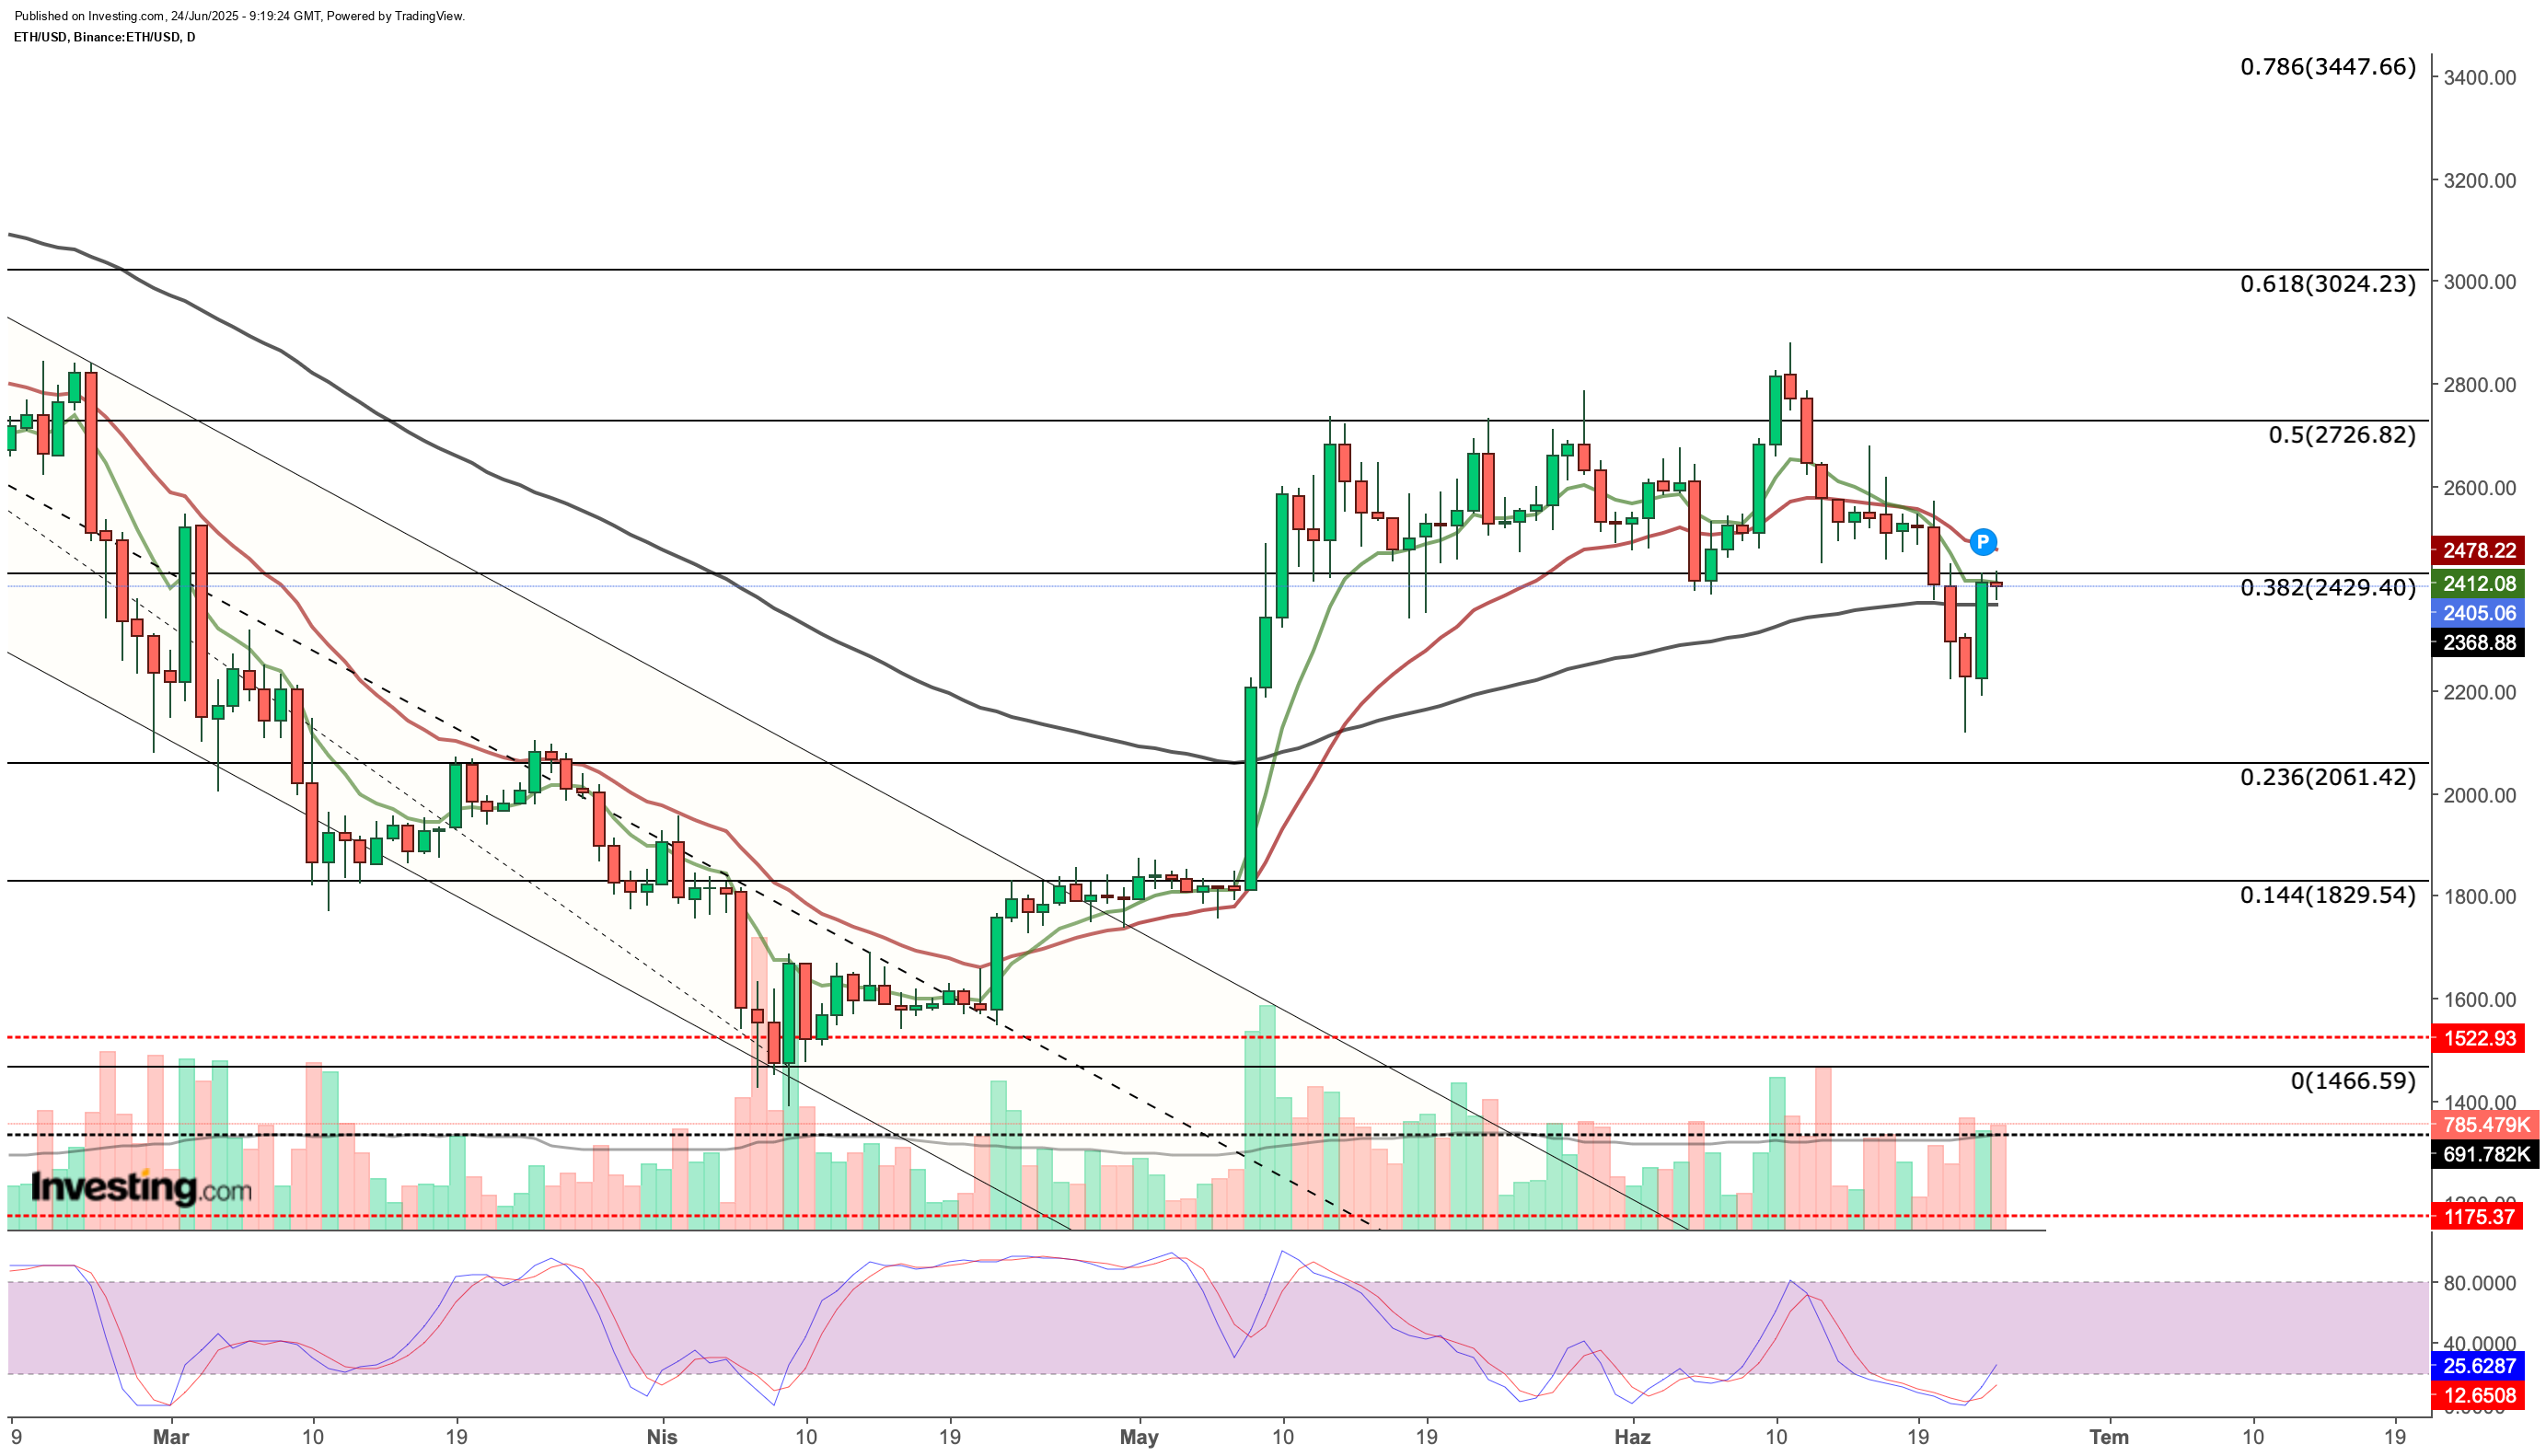
Since May, Ethereum has been struggling to break past the resistance near $2,700. On the downside, it had been holding above the $2,430 support until last week’s selling pressure pushed it down to as low as $2,100. The ceasefire news helped limit further losses, and ETH quickly bounced back to $2,400 on renewed buying.
Right now, the $2,430 level, which previously acted as support, has turned into resistance. If ETH manages to close a day above this level, it could re-enter its former trading range. Continued positive news may then fuel a stronger move toward the next resistance at $2,700. A weekly close above $2,700 could set the stage for a push toward the $3,000 zone.
Technical indicators also suggest that selling pressure is easing. The short-term exponential moving averages have flattened out, pointing to a loss of momentum in the downtrend. Additionally, the Stochastic RSI on the daily chart has started to turn up from oversold territory, signaling a possible recovery. That signal would likely become stronger if ETH breaks back above $2,430.
On the other hand, if Ethereum buyers fail to push the price back above the $2,400 level, the asset may enter a new trading range between $2,000 and $2,300. This would suggest a weaker recovery and could keep ETH under pressure in the short term.
XRP Maintained $2 Support: Can It Turn Upward?
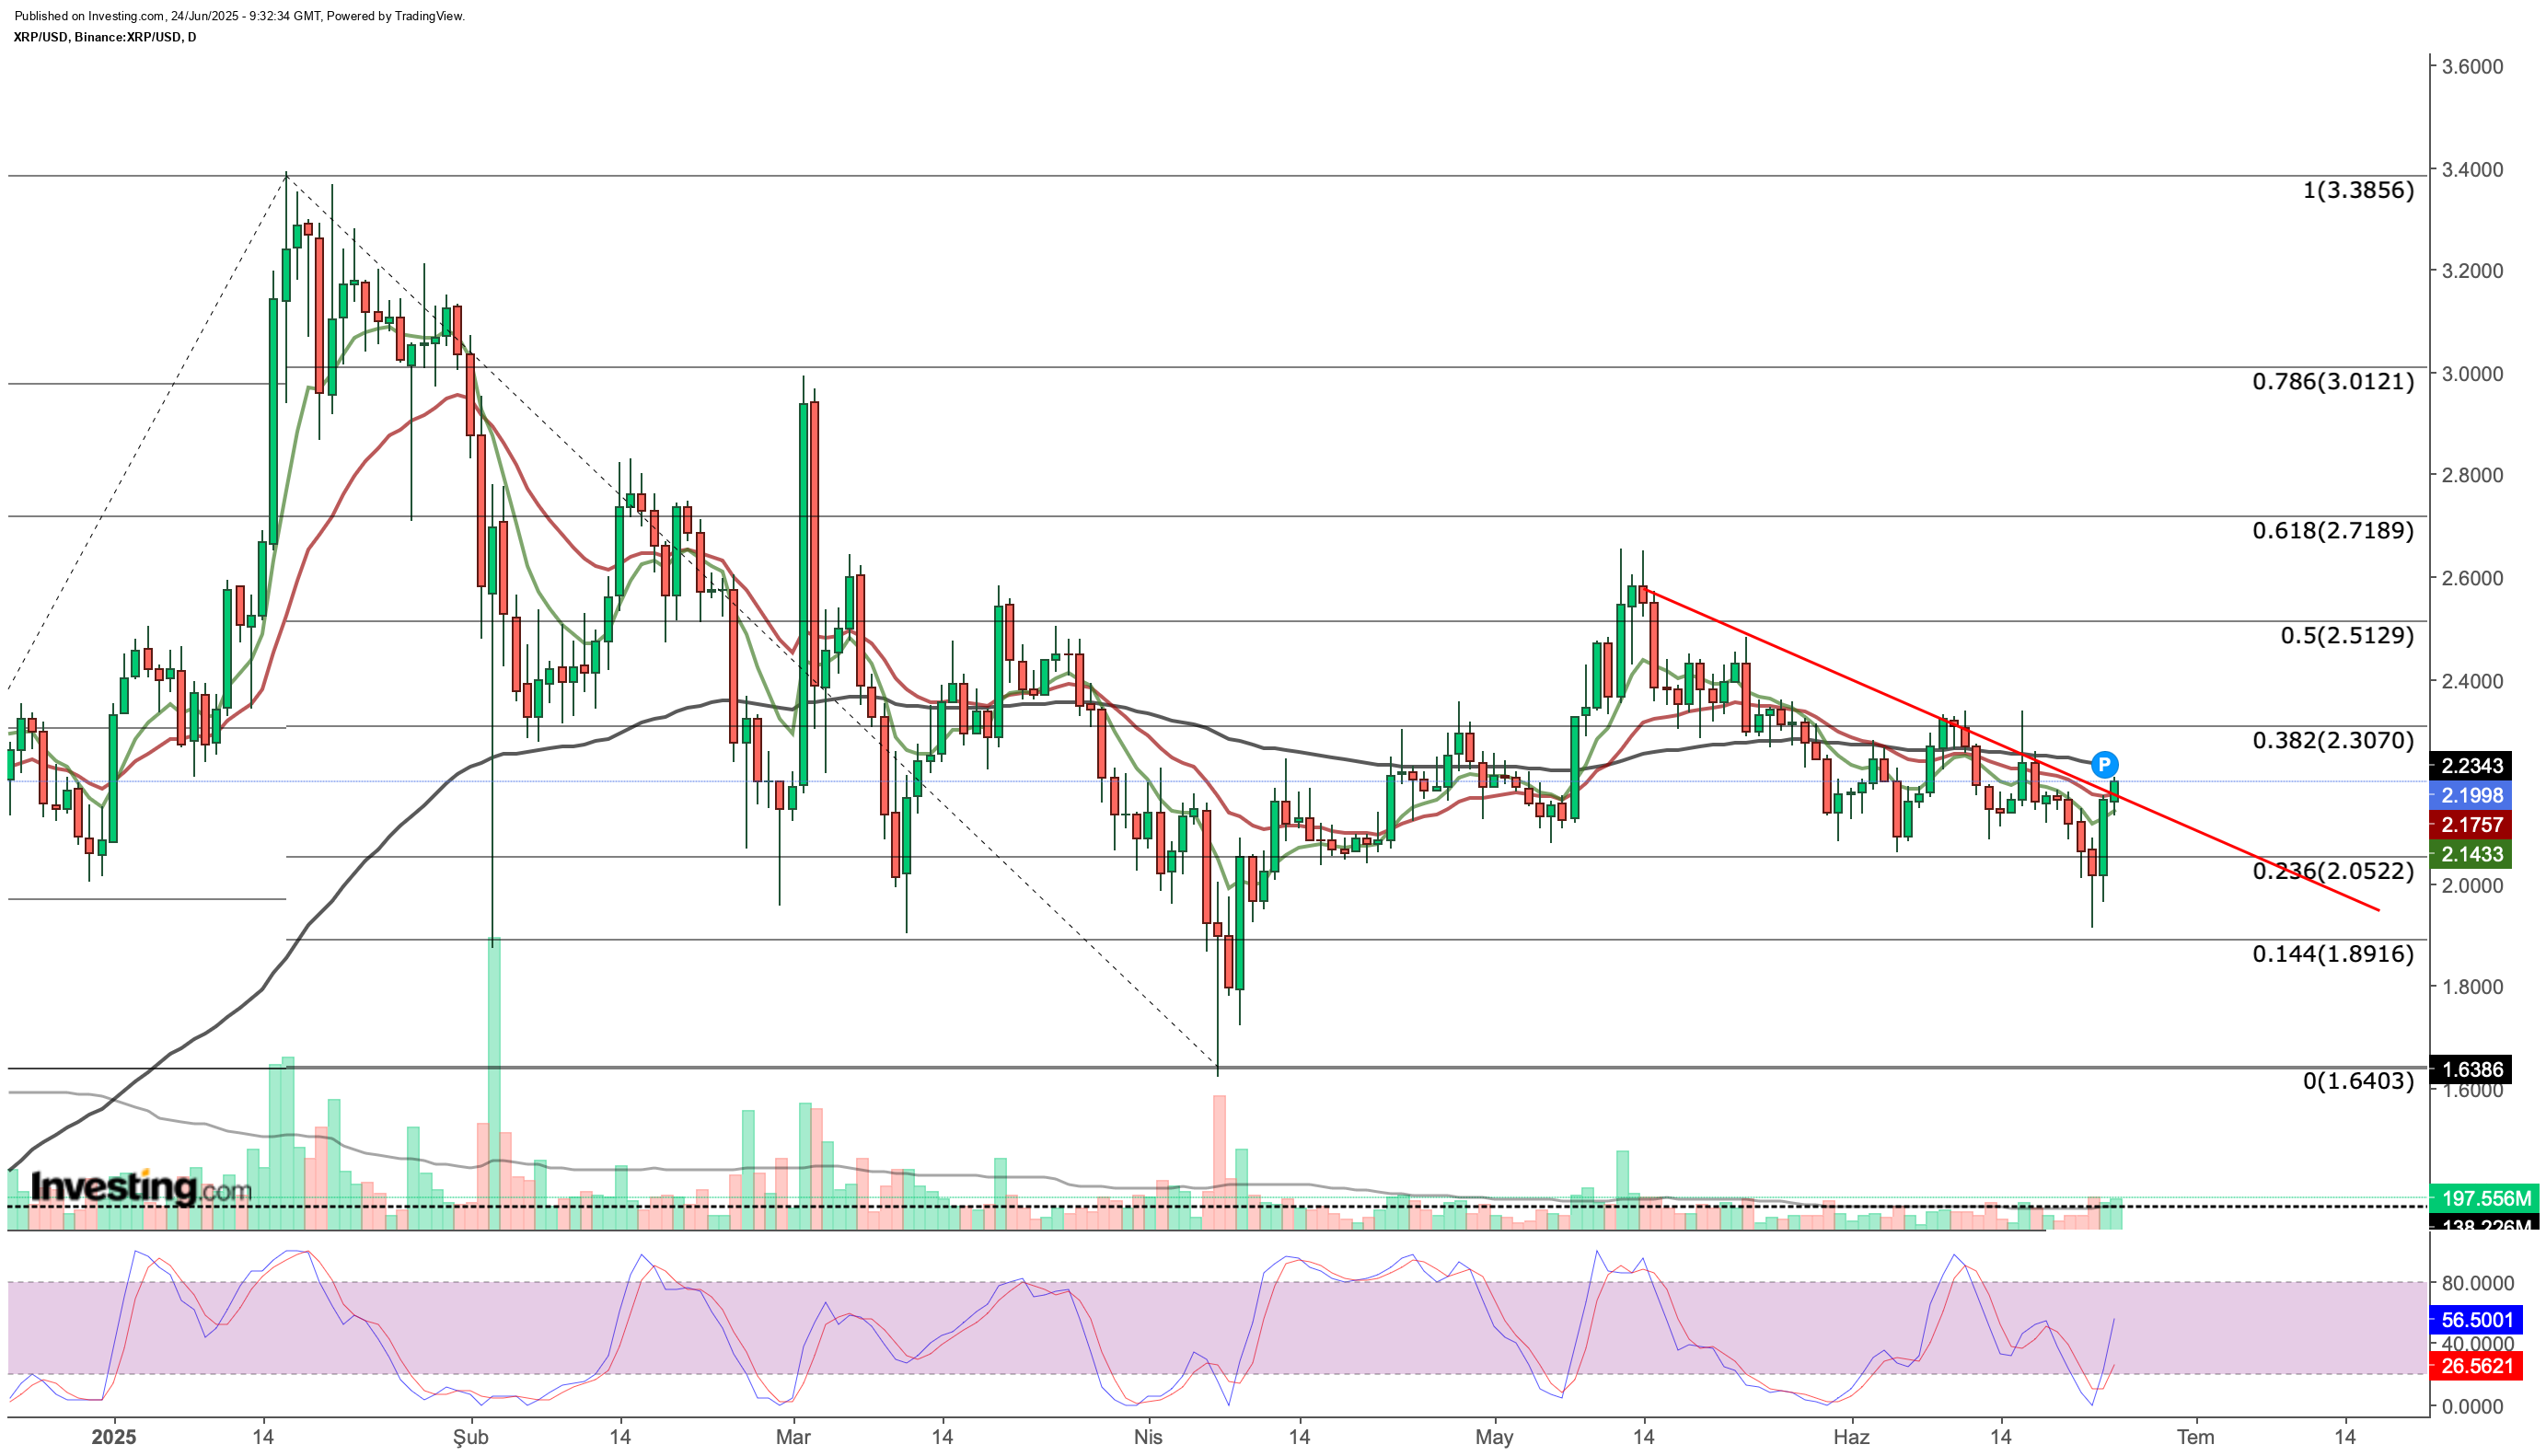
Although XRP briefly dipped below $2 during the weekend’s heightened risk environment, it managed to recover and reclaim the $2 support at the start of the week.
As of now, XRP has climbed to $2.2 and is trying to break out of the short-term downtrend that began in mid-May. If it can secure daily closes above $2.2 and then break the $2.3 resistance, this would signal a strengthening upward trend. In that case, the $2.5–$2.7 resistance zone could come back into focus. A break above this range might open the door for a move toward the $3 mark.
On the downside, if XRP fails to hold above $2.2, it may drop back to test the $2 level again. If it falls and stays below $2, further declines could follow, potentially pushing the price down to $1.9 and even $1.64, especially if global risk sentiment worsens.
SUI Regains Critical Support Zone
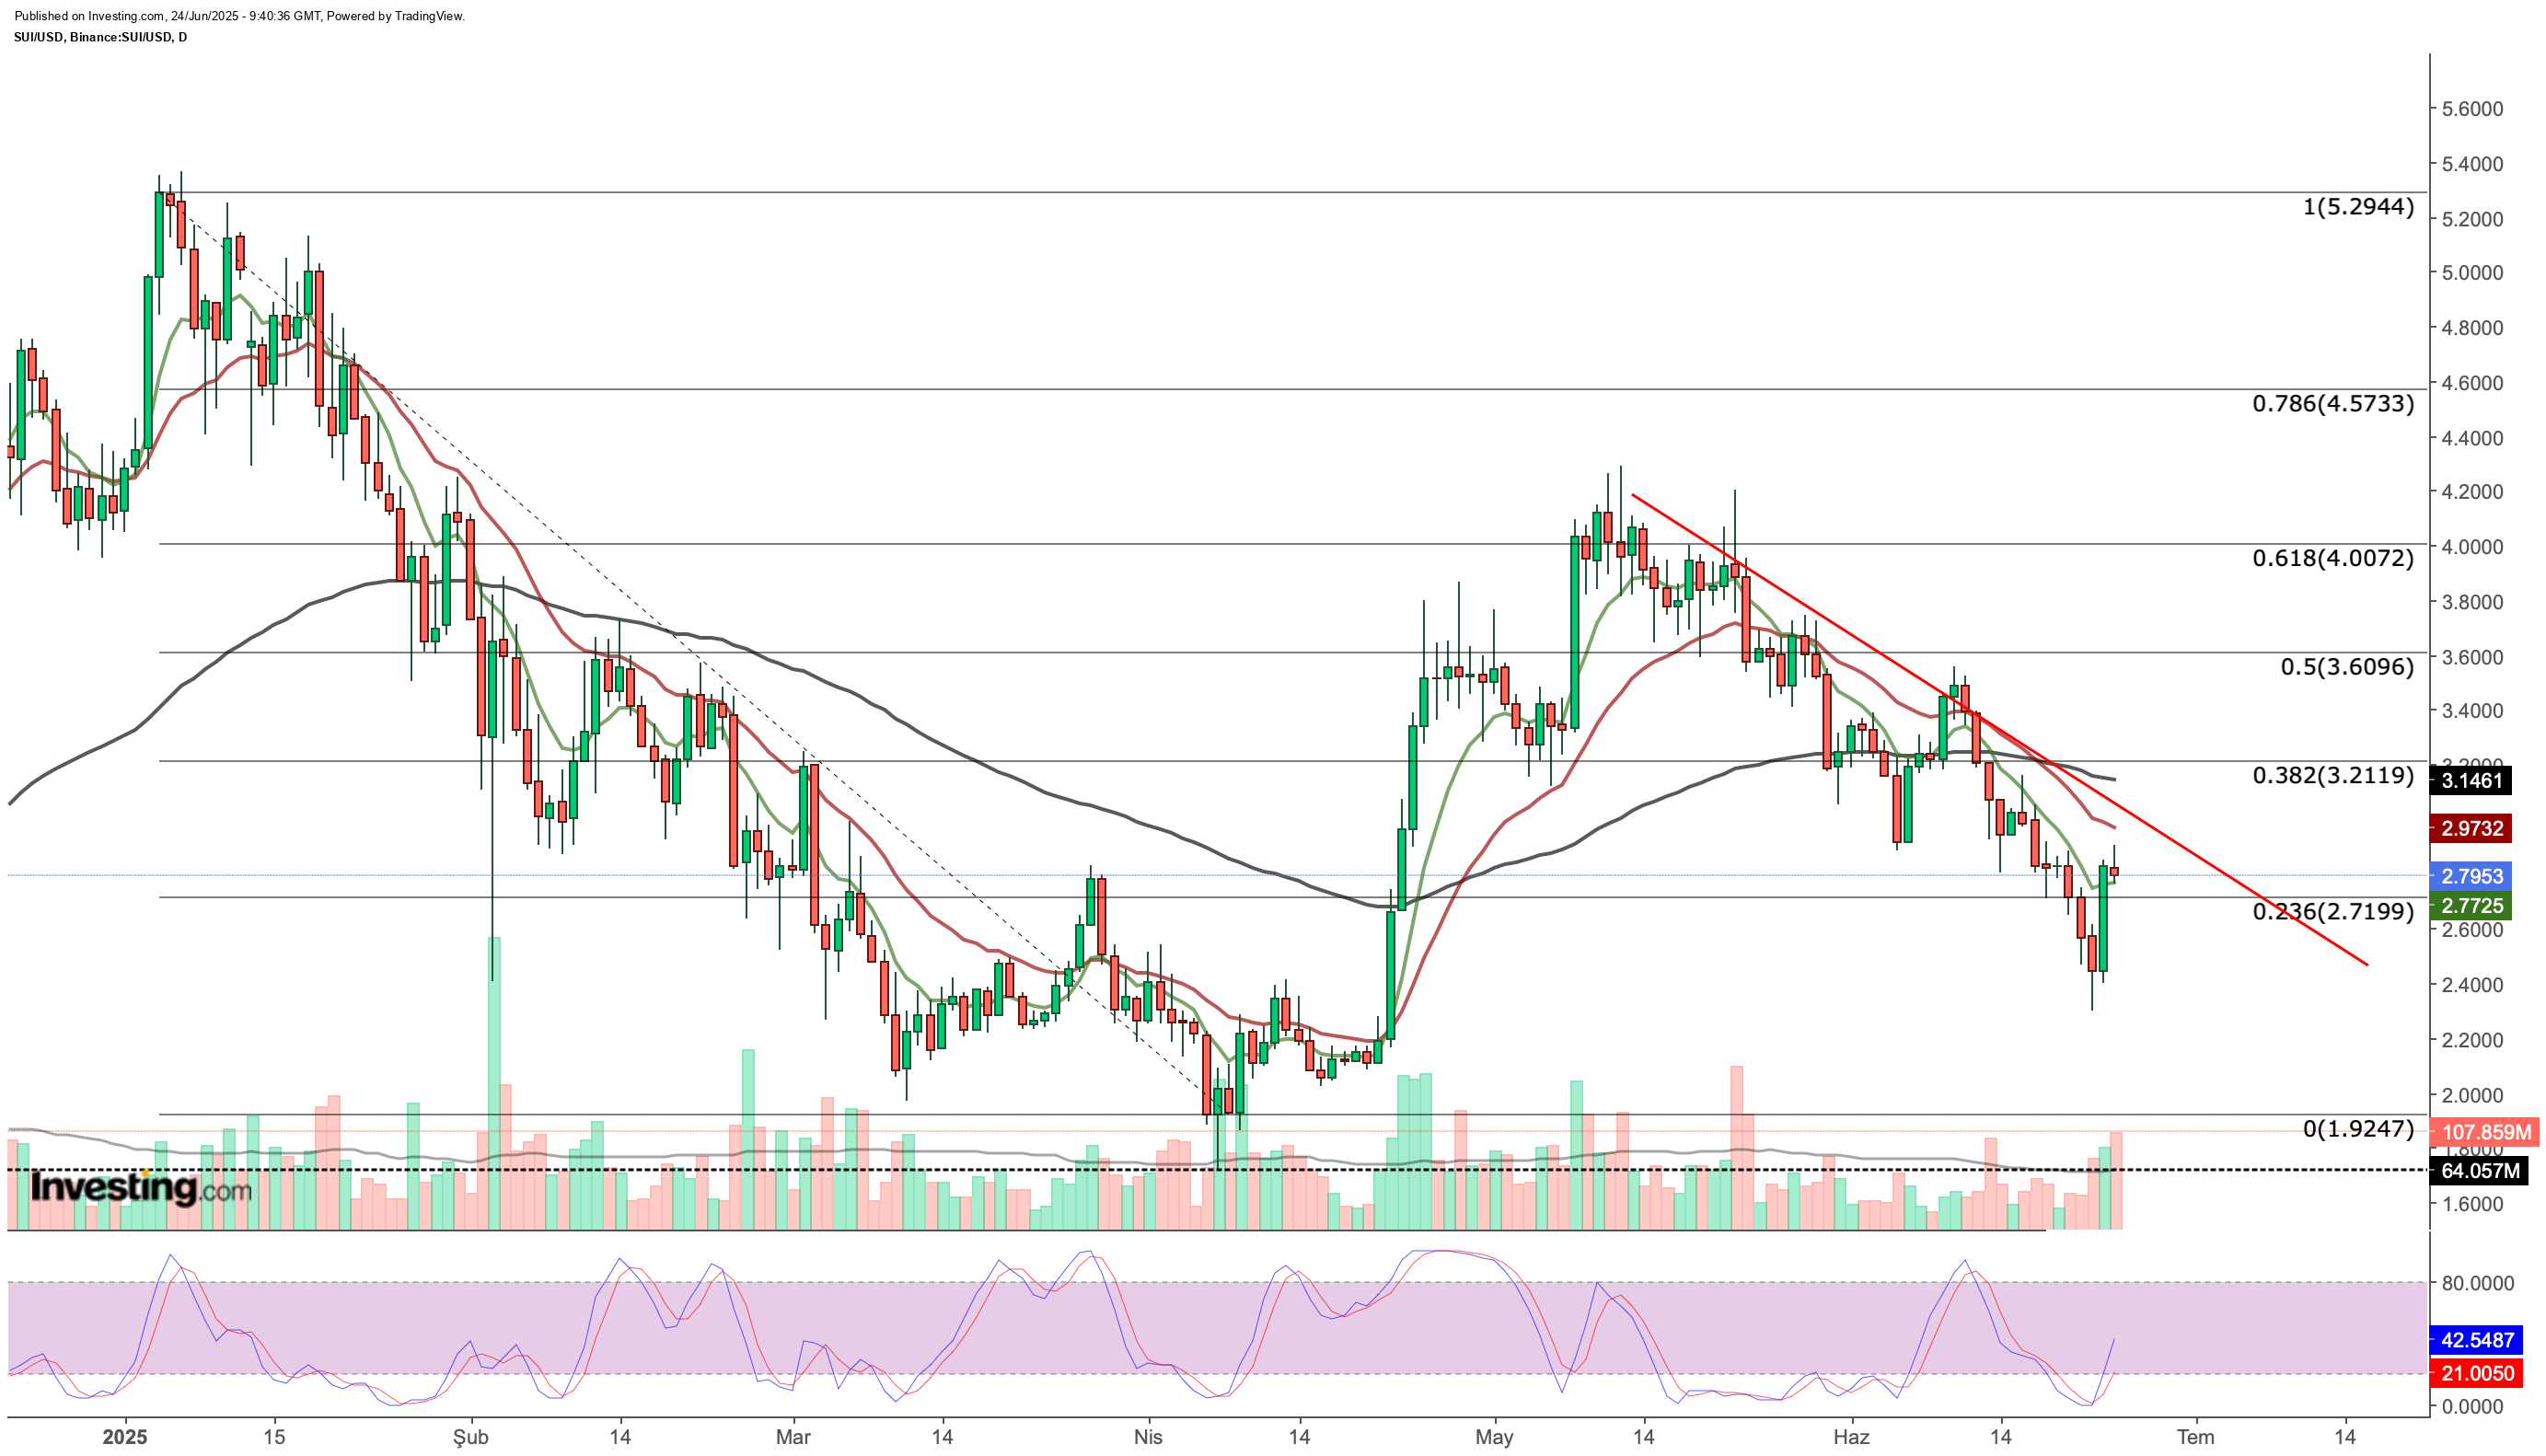
SUI has shown more volatility than most altcoins, following a similar downtrend after dropping from the $4 resistance level last month. Last week, it fell to as low as $2.3 but managed to recover to the $2.7 support zone following positive developments in the last 24 hours.
The $2.7 level is now a key support for SUI. Holding above this area is crucial to avoid further downside. If buying continues, the $3 to $3.2 range will be important to confirm a potential trend reversal. A move beyond this could bring the $3.6 to $4 zone back into focus as a short-term target. However, for a broader bullish trend to take shape, SUI would need to post weekly closes above $4.
If SUI fails to reclaim the $3 level this week, it will remain under its descending trend line. This may trigger renewed selling pressure and could lead to a retest of the $2.4 level. A break below that could open the way for a deeper drop below $2.
****
Be sure to check out InvestingPro to stay in sync with the market trend and what it means for your trading. Whether you’re a novice investor or a seasoned trader, leveraging InvestingPro can unlock a world of investment opportunities while minimizing risks amid the challenging market backdrop.
Subscribe now and instantly unlock access to several market-beating features, including:
- ProPicks AI: AI-selected stock winners with a proven track record.
- InvestingPro Fair Value: Instantly find out if a stock is underpriced or overvalued.
- Advanced Stock Screener: Search for the best stocks based on hundreds of selected filters and criteria.
- Top Ideas: See what stocks billionaire investors such as Warren Buffett, Michael Burry, and George Soros are buying.

Disclaimer: This article is written for informational purposes only. It is not intended to encourage the purchase of assets in any way, nor does it constitute a solicitation, offer, recommendation or suggestion to invest. I would like to remind you that all assets are evaluated from multiple perspectives and are highly risky, so any investment decision and the associated risk belongs to the investor. We also do not provide any investment advisory services.