

The primary focus this week will remain on the bond market, with the Treasury auctions drawing significant attention. On Tuesday, the Treasury will auction a , followed by a on Wednesday and a on Thursday.
These auctions should fare better than last week’s poorly received auction. Still, they take place midday and could have a substantial market impact, especially if they go poorly.
The most recent steepening in the yield curve has come from the back end, as the and yields have risen sharply. Both fundamental and technical indicators suggest these rates could climb even higher. You can watch this week’s YouTube video for more information.
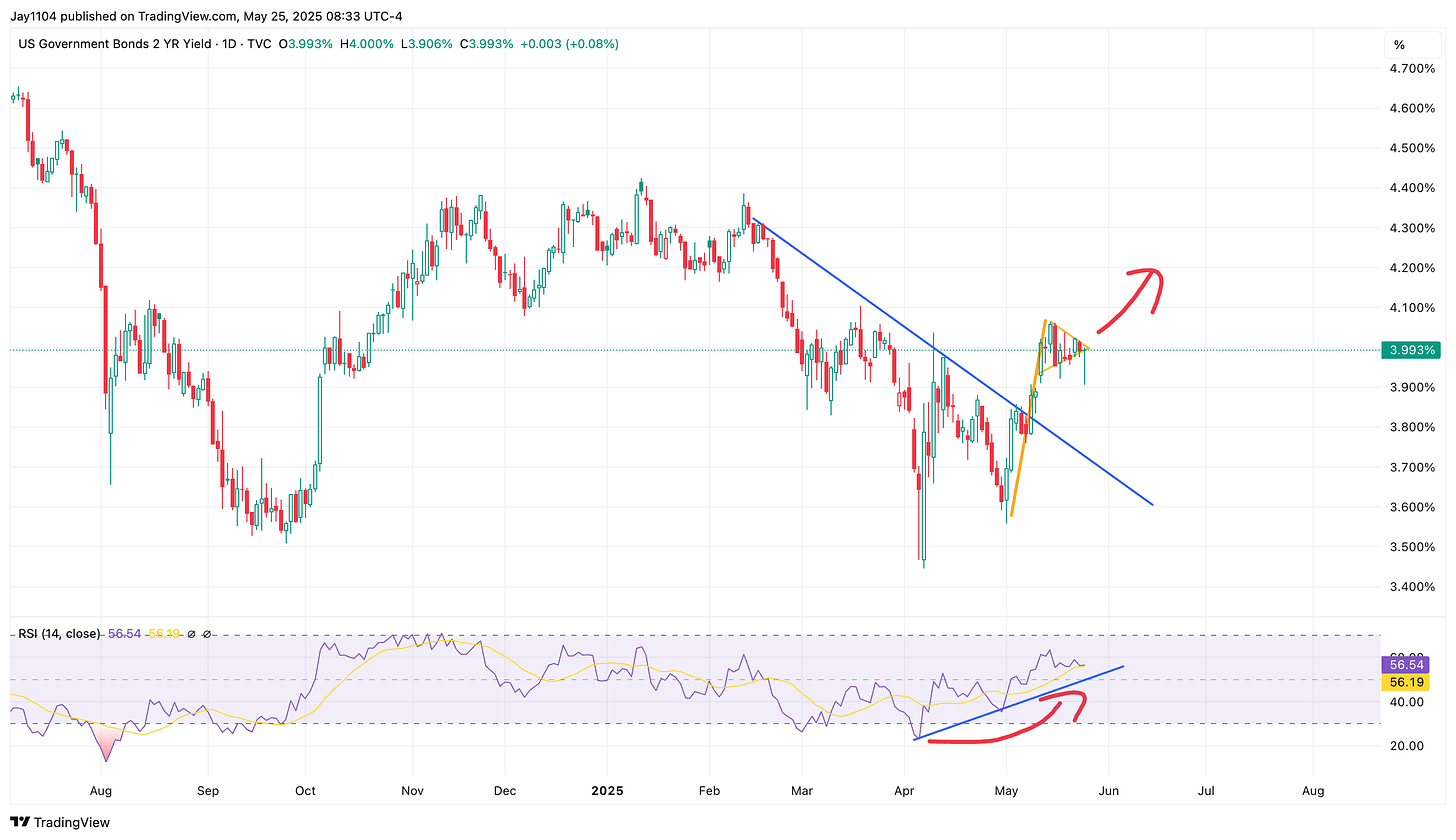
However, short-end rates may also rise in the near term based on technical signals. The RSI on the 2-year yield is trending higher and has turned an important corner, suggesting bullish momentum. Additionally, the 2-year downtrend has broken to the upside and is now consolidating inside a wedge, which could be forming a bull pennant. A breakout above 4% could send the 2-year yield toward 4.25%.
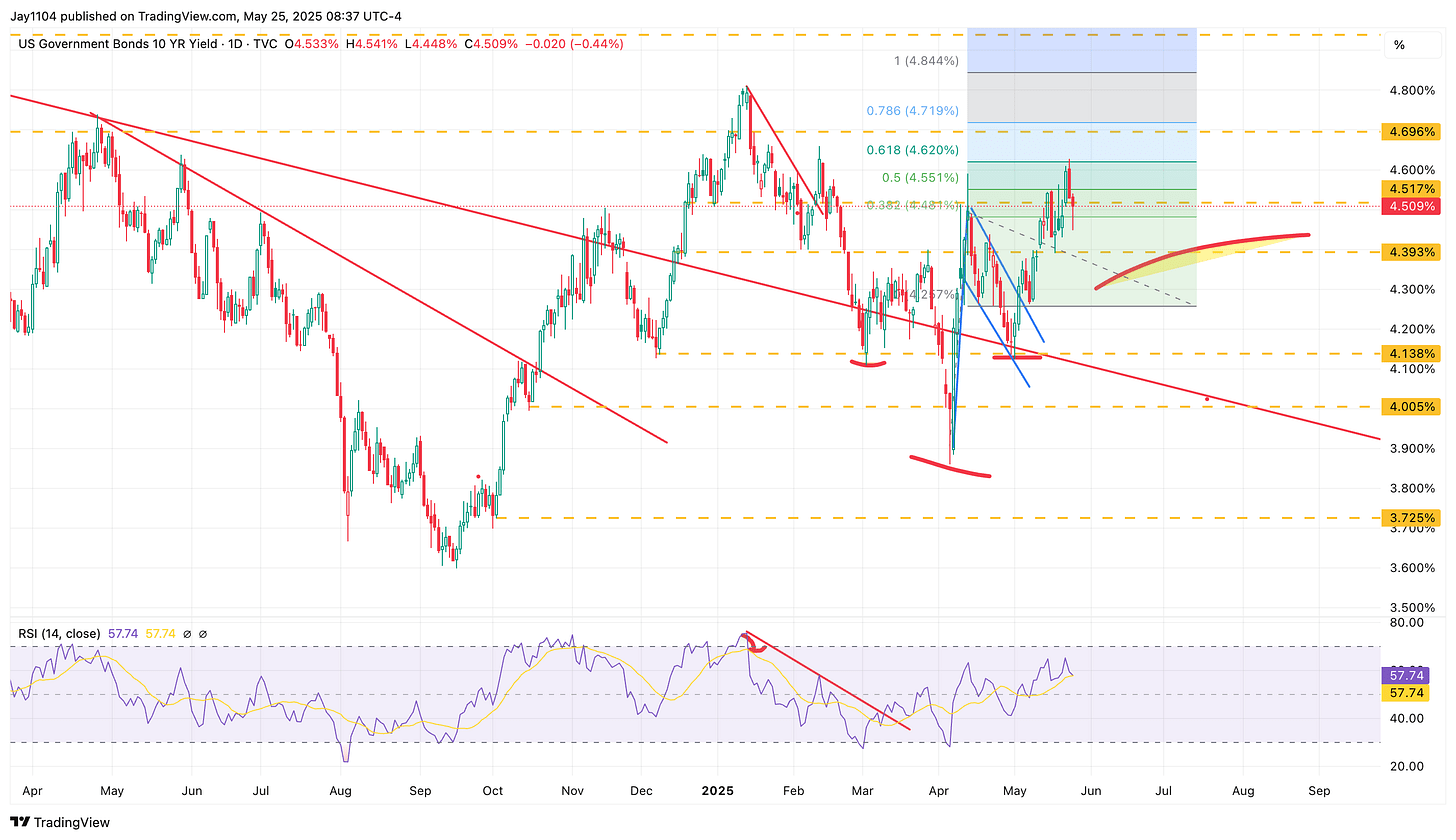
Meanwhile, the 10-year has already broken free of the bull flag, risen about 50% of its projected value, and is likely still heading to around 4.85%.
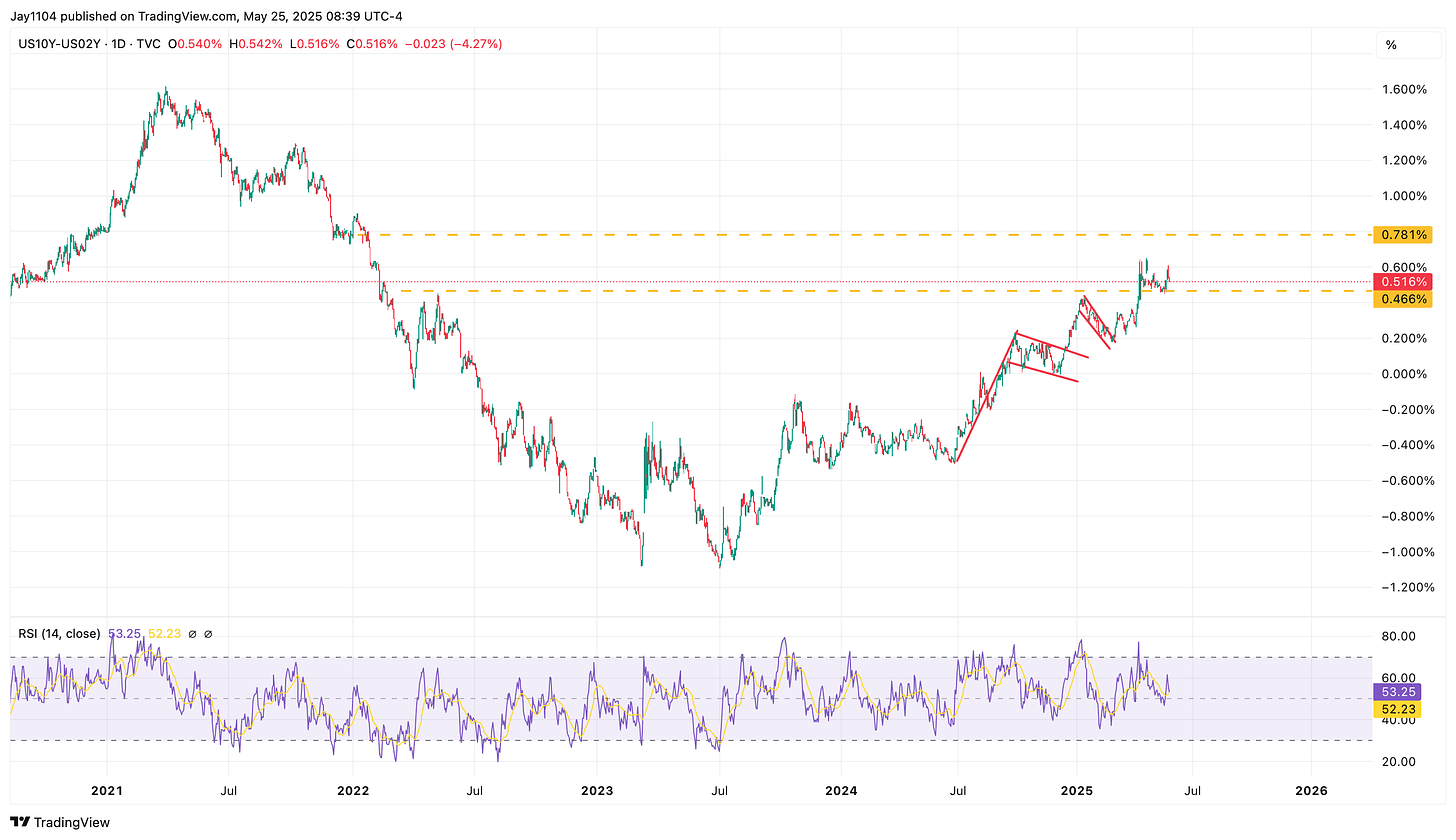
This would suggest that the yield curve will steepen further, with the 10-year rate probably rising slightly faster than the 2-year. I think the spread could widen to about 80 bps.
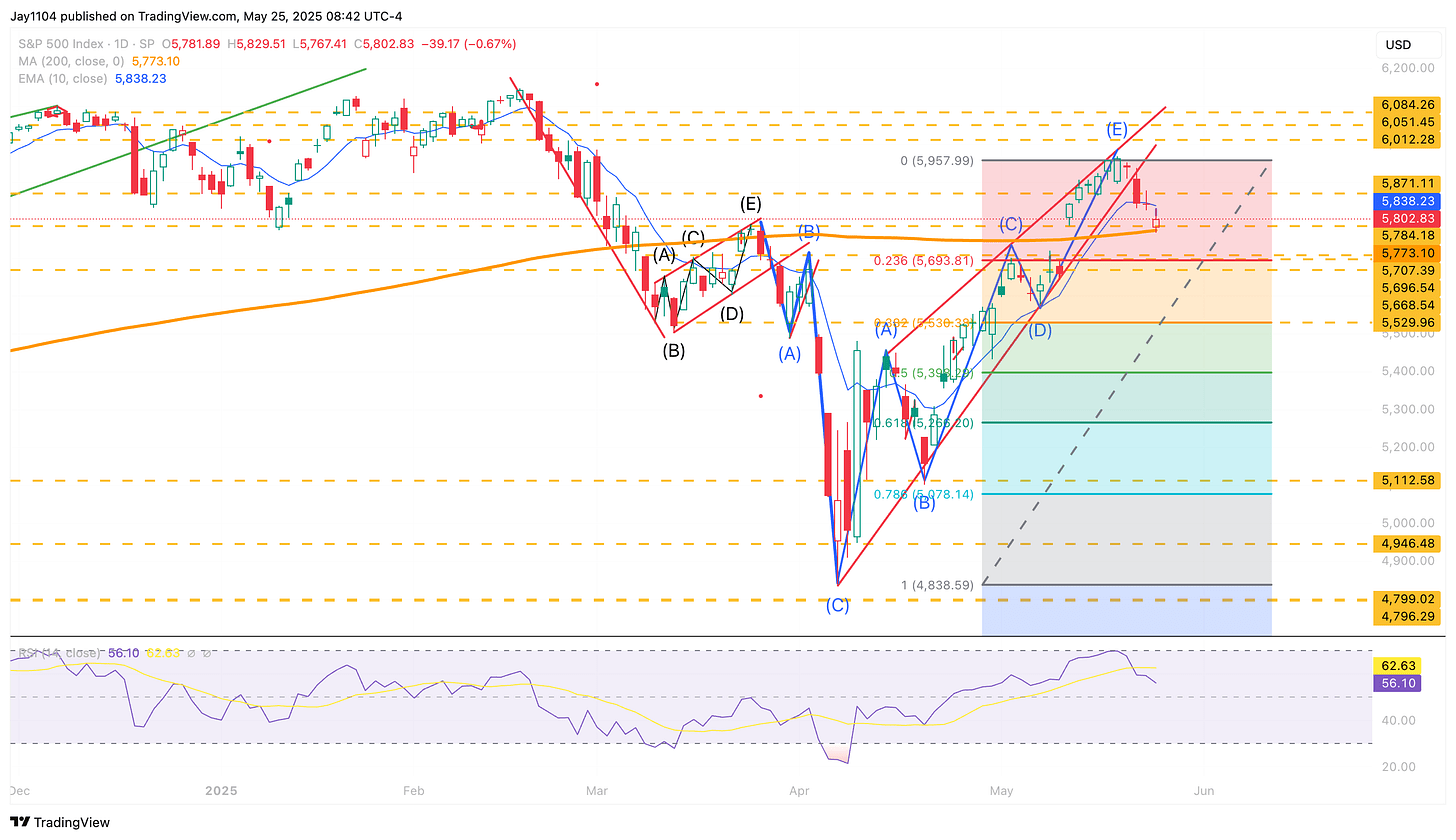
Meanwhile, the appears to have completed a rising wedge pattern. It has now closed below the 10-day exponential moving average for a third consecutive day, while finding support at the 200-day moving average. If this is indeed a rising wedge, a typical retracement would suggest a move to at least 5,260, representing a 61.8% retracement of the recent advance.
The strongest confirmation of this pattern would come if the index gaps below the 200-day moving average when trading resumes on Tuesday, which would also create an island reversal top. However, if the index advances beyond 6,000, it would invalidate the setup.
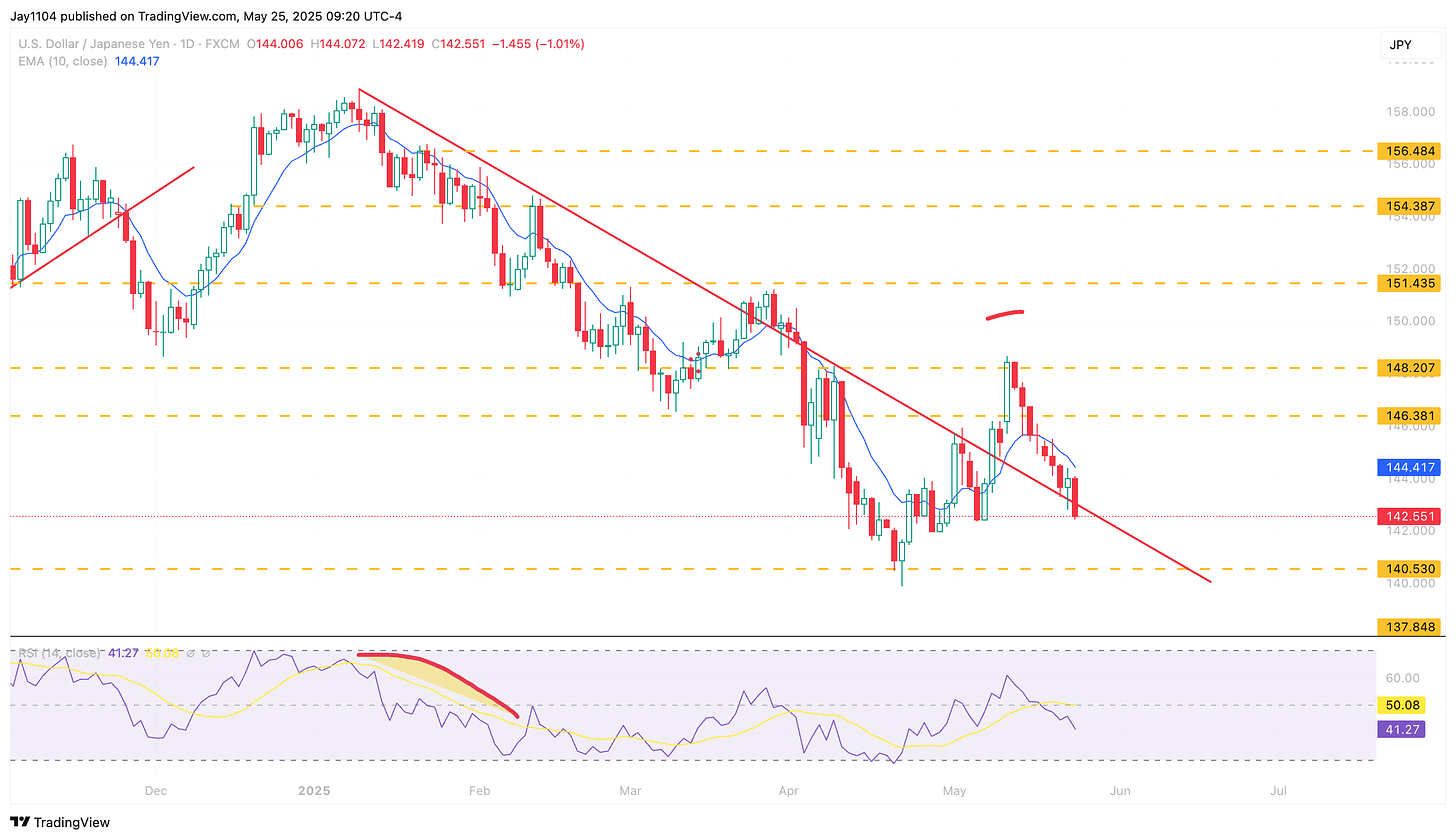
However, I think there’s a good chance the decline will play out, as we’re seeing the move lower. It has fallen below a trendline previously broken above, effectively invalidating the bullish breakout. This suggests the USD/JPY is likely to strengthen back toward 140.
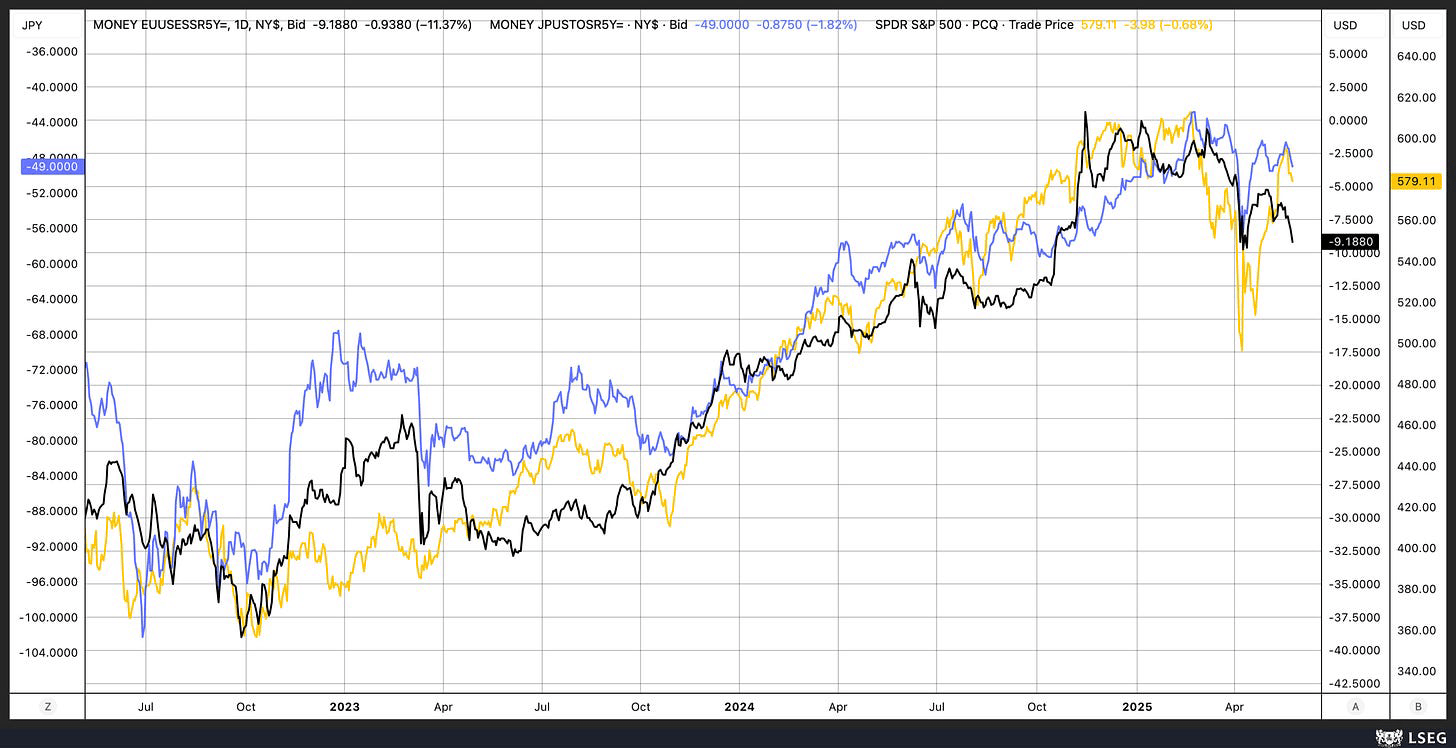
Additionally, funding cost are starting to increase for the and , and that is typically a bearish indicator for the S&P 500 as well.
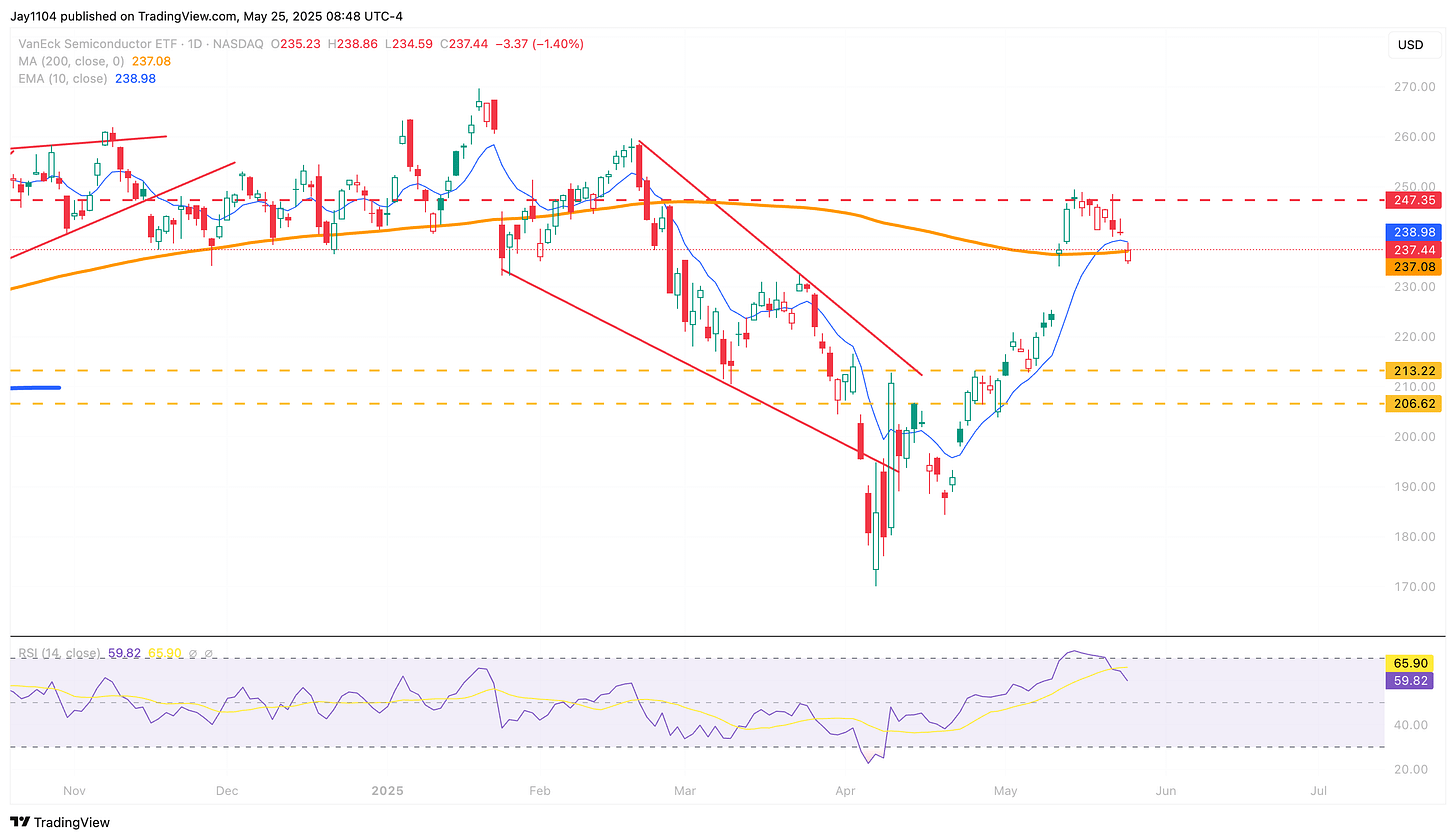
On Friday, the gapped below its 200-day moving average, which acted as resistance for the remainder of the day. Additionally, it appears that SMH has formed an island reversal top.
Nvidia (NASDAQ:) reports results this week, and it will be interesting to see if they stick to the usual playbook—beating estimates by $2 billion and raising guidance by another $2 billion above the beat. This quarter, however, may be different, given the headwinds from export controls they’ve previously flagged.
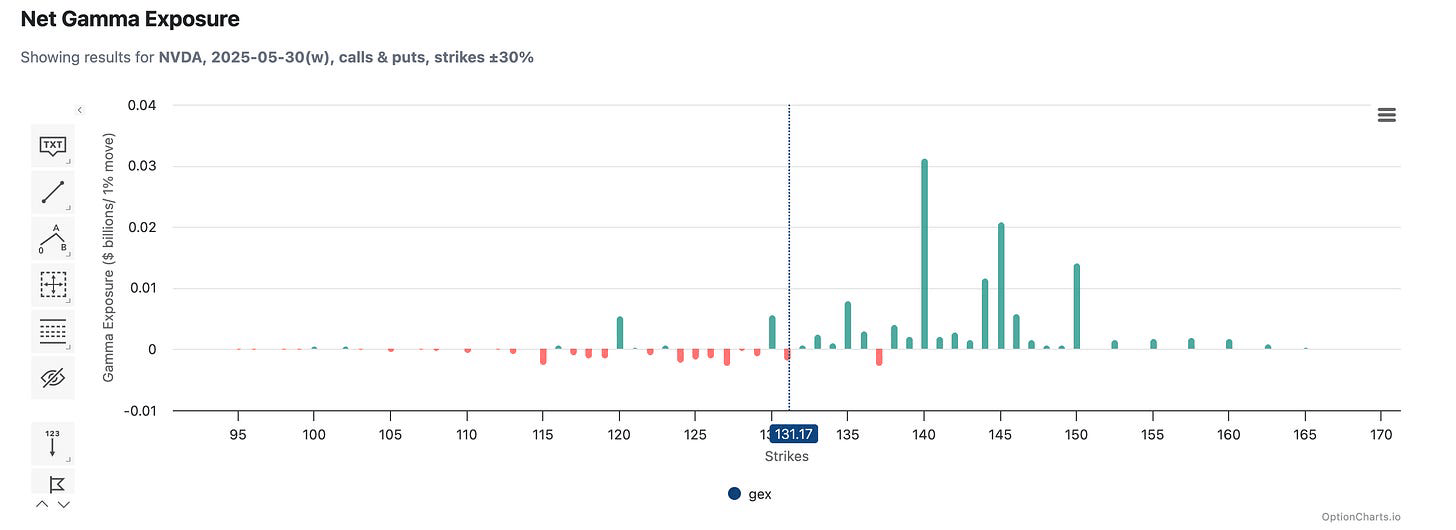
A large amount of gamma is concentrated at the $140 level, which is likely to act as resistance. Nvidia will need to break through that level following earnings—otherwise, the stock could be in trouble.
Delta values are very positive, which means that as implied volatility (IV) rises heading into earnings, it’s more likely to crash afterward. This increases the chances of post-earnings selling pressure, as call premiums decay and traders unwind bullish positions.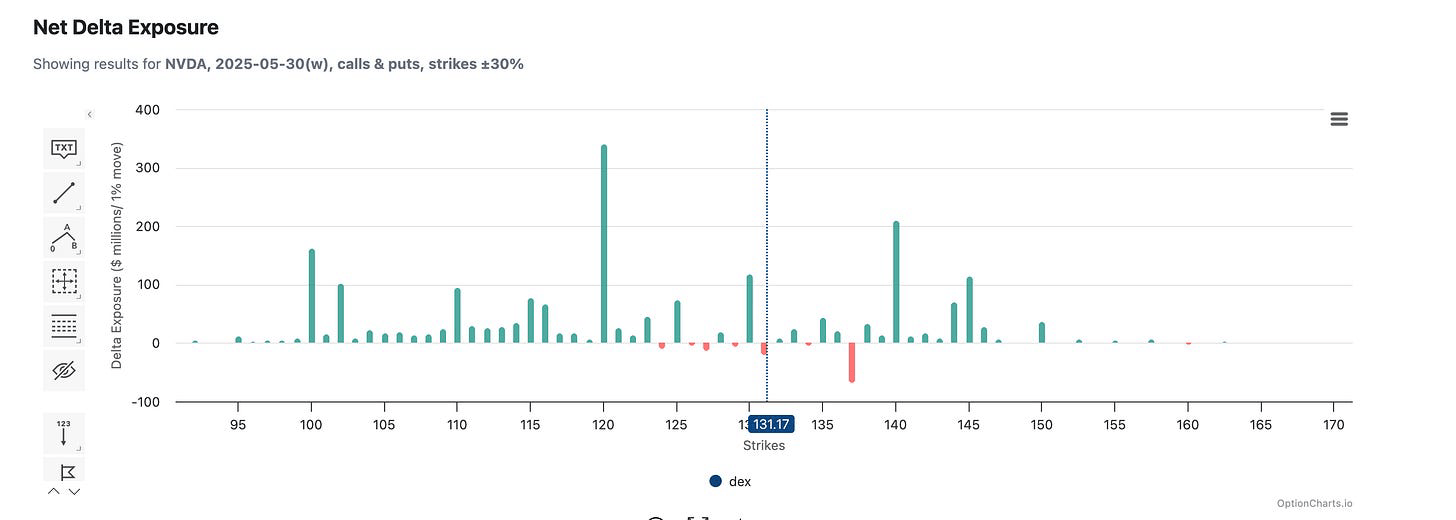
IV is currently around 77.5% and could exceed 100% when Nvidia reports. That’s making both calls and puts increasingly expensive. For example, a $131 call expiring Friday is currently priced at $5.30, meaning the stock needs to rise above $136.30 to break even. If IV jumps to 120%, that call could cost around $7.65, pushing the breakeven closer to $138.65. While that move isn’t impossible, the rising cost of options raises the bar for profitability.
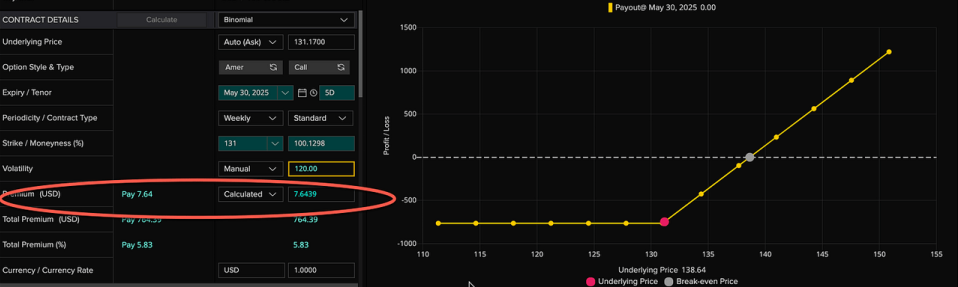
Source: LSEG
Once results are released and IV drops to, say, 60%, the value of those calls could fall to around $3.89. That’s a significant decline, meaning many previously profitable calls may no longer be in the money and could start getting sold. So, unless the results are strong enough to push the stock above $140, the narrative will quickly become: “The results just weren’t good enough.”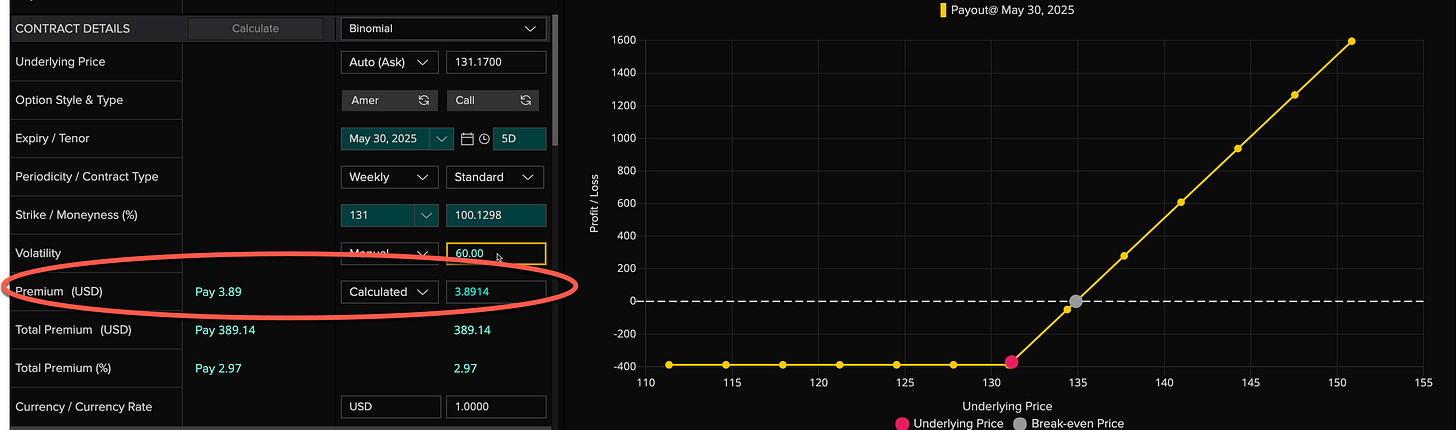
Source: LSEG
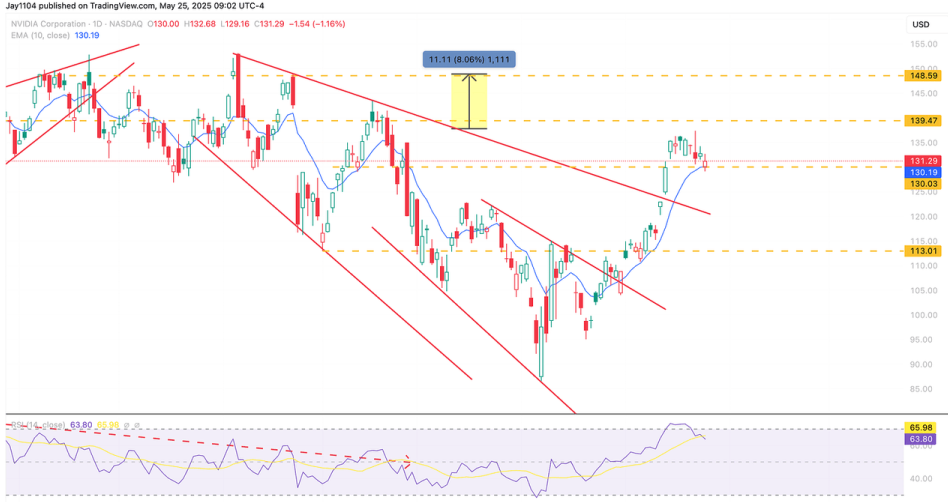
Technically, a drop below $130 would set up a move back toward $115.